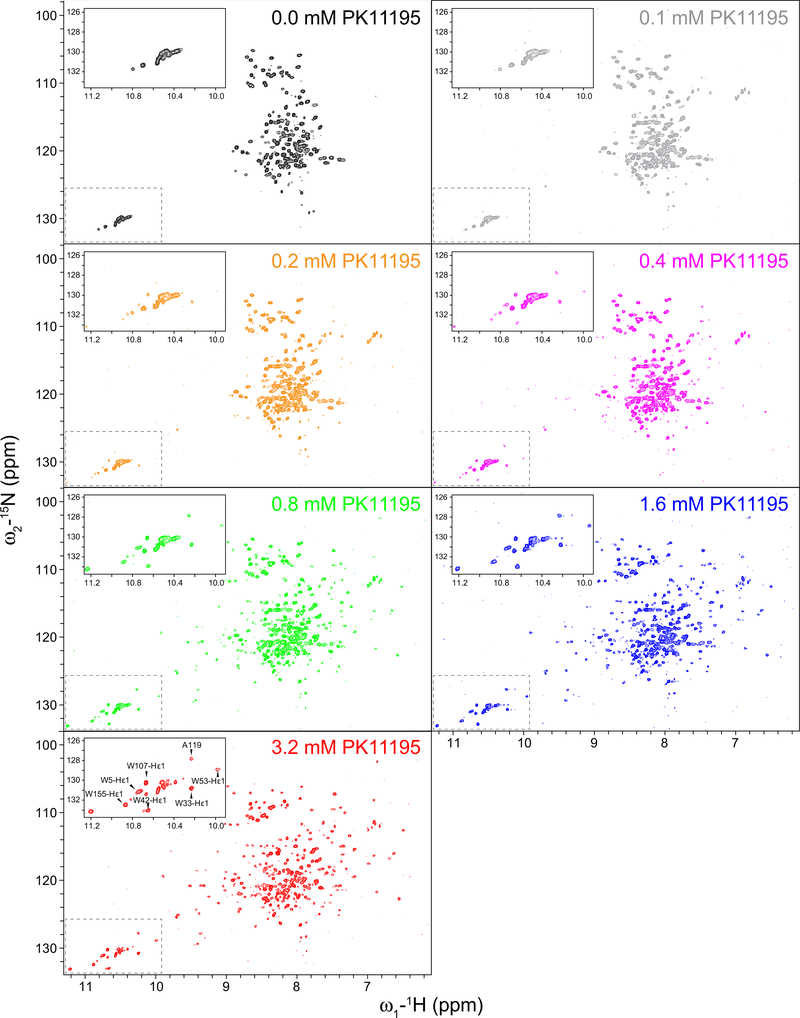
Fig. 3.
PK11195 binding to mTSPO reconstituted in DPC detergent micelles followed by NMR. Series of 1H–15N TROSY-HSQC NMR spectra of apo-mTSPO in the absence of PK11195 (black) and with increasing concentrations of PK11195. An enlarged view of the tryptophan sidechain region is shown in the upper left corner to signify peak changes upon the addition of ligand. The assignment of selected NMR peaks that appear upon addition of PK11195 is shown in the lower spectrum corresponding to a PK11195 concentration of 3.2 mM

