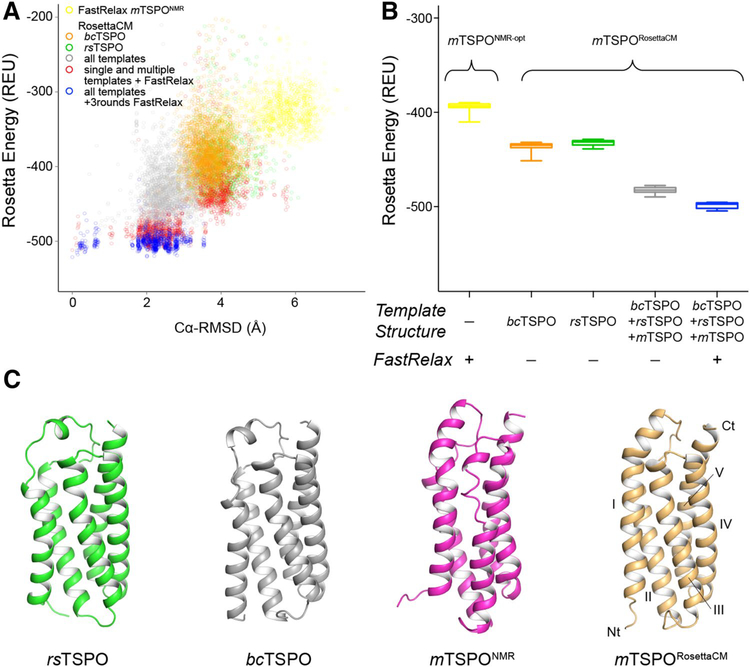
Fig. 4.
Rosetta homology modeling of mTSPO improves model energy over available structural templates. A Rosetta energy vs. Cα-RMSD plot for energy-minimized mTSPONMR-opt and mTSPORosettaCM models created with different sampling strategies. The RMSD was calculated relative to the final lowest-energy mTSPORosettaCM model after one round of RosettaCM and three rounds of energy minimization with FastRelax (Conway et al. 2014). The colors refer to the following sampling strategies: optimization of mTSPONMR with Rosetta FastRelax (yellow), RosettaCM based on bcTSPOX-Ray (orange), RosettaCM based on rsTSPOX-Ray (green), RosettaCM based on bcTSPOX-ray, rsTSPOX-ray and mTSPONMR (gray); additional energy minimization of single and multiple template mTSPORosettaCM models with FastRelax (red), three rounds of FastRelax on multiple template mTSPORosettaCM models (blue). B Box plot of the Rosetta energy of the top 20 models produced by each sampling strategy. The color scheme follows that of panel A. The relaxed mTSPORosettaCM model has improved energy over other Rosetta models. c Cartoon representation of experimental TSPO structures and the mTSPORosettaCM model. The flexible tail region (mTSPO residues 160–169, rsTSPO residues 151–157) is omitted for clarity. The N- and C-terminus and TM helix regions are labeled. The Cα-RMSD of mTSPORosettaCM relative to the experimental templates was calculated after sequence-independent structural alignment with DALI (Holm and Rosenström 2010): 4.1Å (mTSPONMR), 3.3Å (bcTSPOX-Ray) and 3.5Å (rsTSPOX-Ray)

