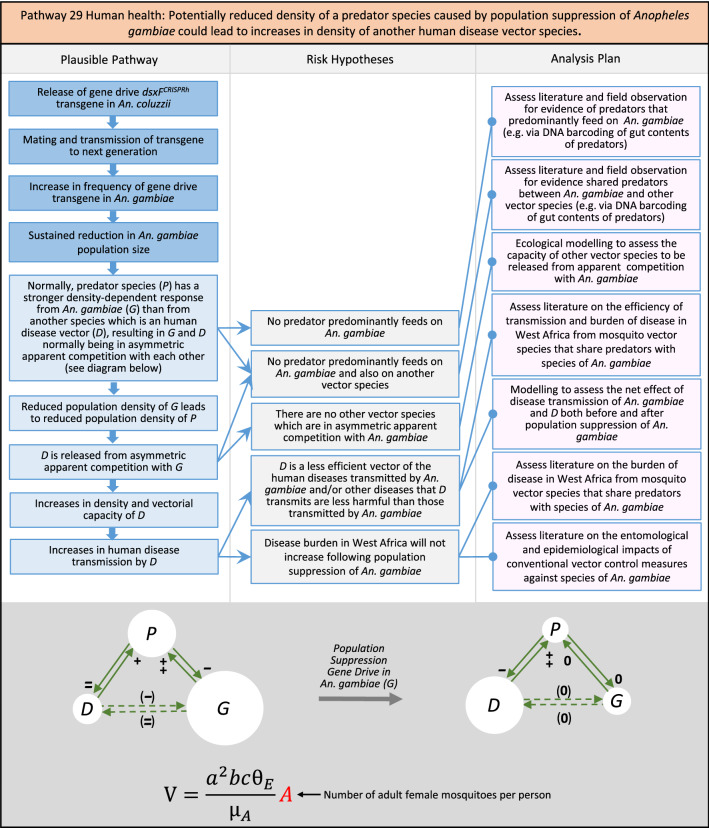
Fig. 31.
Pathway 29 Human health: Potentially reduced density of a predator species caused by population suppression of Anopheles gambiae could lead to increases in density of another human disease vector species. Species P denotes a predator of both An. gambiae (G) and another human disease vector species, D. Solid green lines represent direct effects of one species on another. Dashed green lines indicate indirect effects from apparent competition [109]. Size of white circles denotes notional size of species populations. The + symbol denotes a positive effect on the species at the arrowhead, with + + indicating stronger positive effects. The - symbol denotes a negative effect on the species at the arrowhead, with - - indicating stronger negative effects. 0 denotes a negligible effect on the species at the arrowhead. When symbols are within parentheses, this denotes an indirect effect on the species at the arrowhead. In this pathway, the asymmetric apparent competition between G and D (for example, see Fig. 1b in [109]), before population suppression gene drive is introduced in G, is lost following population suppression gene drive introduction, leading to reductions in the density of P and increases in the density of D. Sustained reduction in the population of An. gambiae could also lead to reduction in the density of a valued predator if that predator would, for example, feed predominantly on An. gambiae in the wet season and then switch to feeding on, and controlling the numbers of, another disease vector or pest in the dry season, when An. gambiae would not typically act as its predominant food source during that period. The components of vectorial capacity (V) that would be affected in this pathway are shown in red in the equation

