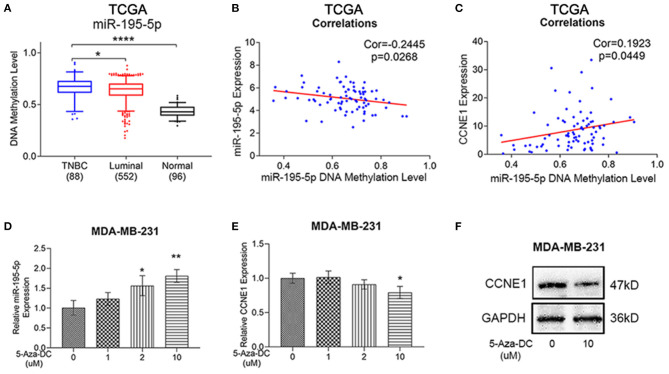
Figure 6.
Methylation levels of miR-195-5p promoter region in TNBC. (A–C) TCGA BRCA database showed DNA methylation of miR-195-5p in TNBC samples as compared with luminal-type breast cancer or normal breast samples (A), miR-195-5p DNA methylation level and miR-195-5p expression correlation in TNBC (n = 82) (B), miR-195-5p DNA methylation level, and CCNE1 expression correlation in TNBC (n = 82) (C). (D) qRT-PCR of miR-195-5p expression in MDA-MB-231 cells with or without 5-AzaDc treatment. (E,F) mRNA (E) and protein (F) level of CCNE1 expression in MDA-MB-231 cells with or without treatment. *p < 0.05; **p < 0.01; ****p < 0.0001.

