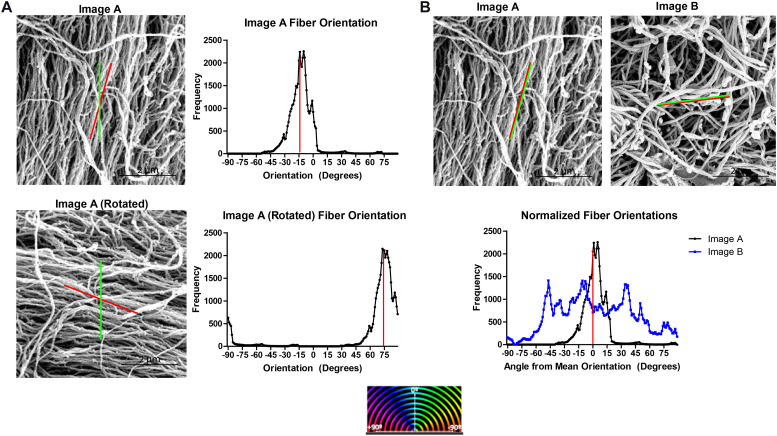
FIGURE 2.
Normalizing ECM fiber orientation distributions allows comparison of distinct samples and combination of replicates. (A) Fiber orientation distribution output by DiameterJ for a SEM micrograph of decellularized ECM (Image A) and the same image rotated 90° for which the mean fiber orientation (red line) and orientation set as 0° by DiameterJ (green line) are superimposed. Red stripes indicate the distribution’s mean. (B) Superimposed normalized fiber orientation distributions for Image A and a separate SEM micrograph, Image B, generated by subtracting the mean fiber orientation from all angle orientations, shifting the distributions’ means to 0°.

