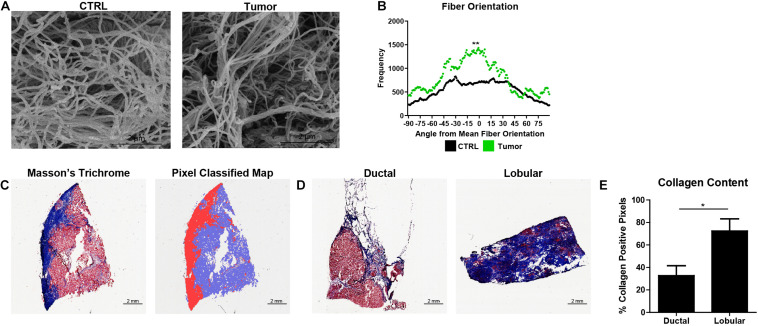
FIGURE 6.
Normalized orientation distributions and pixel classification allow quantification of ECM dysregulation in primary breast tumors. (A) SEM micrographs of decellularized ECM from human breast tissue (CTRL) and decellularized ECM from a primary human breast tumor. (B) Normalized fiber orientation distributions for the human breast tissue (CTRL) (n = 14) and breast tumor ECM (n = 1) (p = 0.003221). (C) Masson’s Trichrome stain of frozen breast section and corresponding probability map generated by pixel classification, in which red pixels indicate collagen deposition, blue pixels indicate areas with no collagen, and white pixels indicate background. (D) Masson’s Trichrome stains of lobular carcinoma and ductal carcinoma. (E) Collagen content (mean + SEM) of lobular carcinoma (n = 4) and ductal carcinoma (n = 6) (p = 0.026779). *Indicates p < 0.05 and ** indicates p < 0.005.

