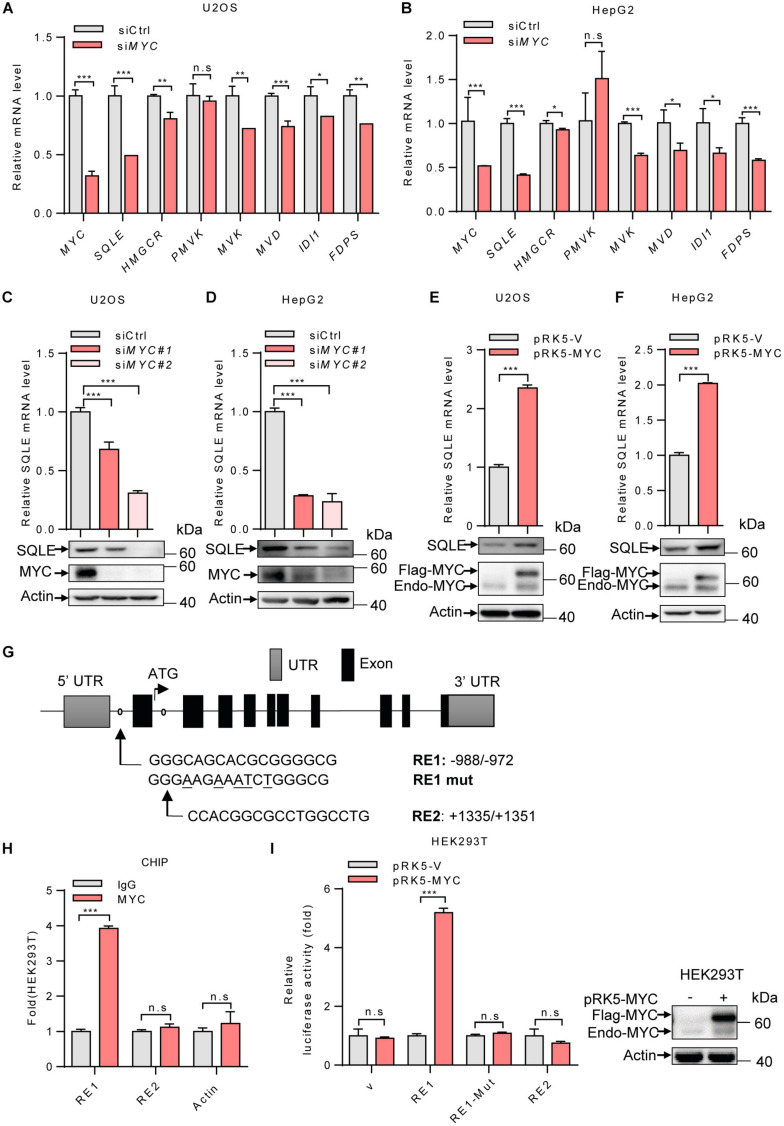
FIGURE 2.
MYC transcriptionally upregulates the expression of SQLE. (A,B) U2OS cells and HepG2 cells were transfected with control or MYC siRNA. The mRNA levels of seven metabolic enzymes in cholesterol synthesis pathway were detected by qPCR. (C,D) SQLE mRNA (top) and protein (bottom) expression in control and MYC knockdown U2OS and HepG2 cells. (E,F) SQLE mRNA (top) and protein (bottom) expression in U2OS and HepG2 cells expressing ectopic MYC or control protein. (G) Schematic representation of human SQLE genomic structure. Shown are the putative MYC response elements (RE1/RE2), and the mutant response element (RE1-mut, with mutated nucleotides underlined). Arrows mark the positions of the primers used for qPCR in the ChIP assay. UTR, untranslated region. (H) HEK293T cells were analyzed by ChIP assay using an anti-MYC antibody or rabbit IgG control. (I) Luciferase assays performed using reporter constructs containing the wild-type or mutant MYC response element were transfected into HEK293T cells, together with or without ectopically expressed MYC. Renilla vector was used as a transfection internal control. Relative levels of luciferase are shown (left). MYC expression in HEK293T cells was detected (right). In (A–F,H,I) n = 3 independent experiments. Data are means ± SD. Statistical significance was determined by two-tailed unpaired t-test. *P < 0.05, **P < 0.01, and ***P < 0.001.

