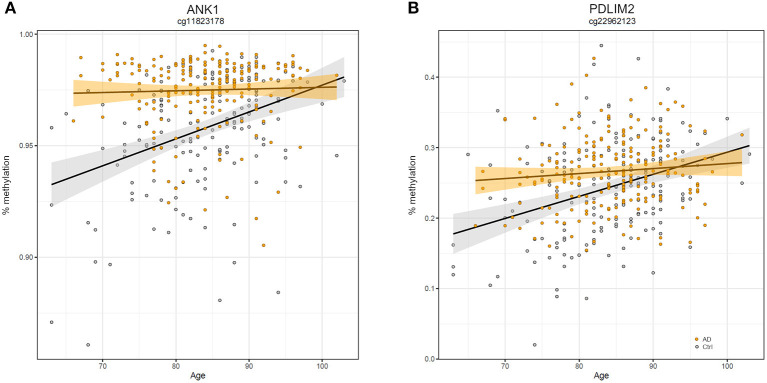
Figure 5.
Scatter plots of ANK1 and PDLIM2 DNAm according to age and disease. Scatter plots of methylation values of cg11823178 within ANK1 (A) and of cg22962123 within PDLIM2 (B) in TC from GSE134379 dataset. Healthy subjects are colored in gray while AD patients are in orange. Regression lines and confidence intervals within each group are reported.

