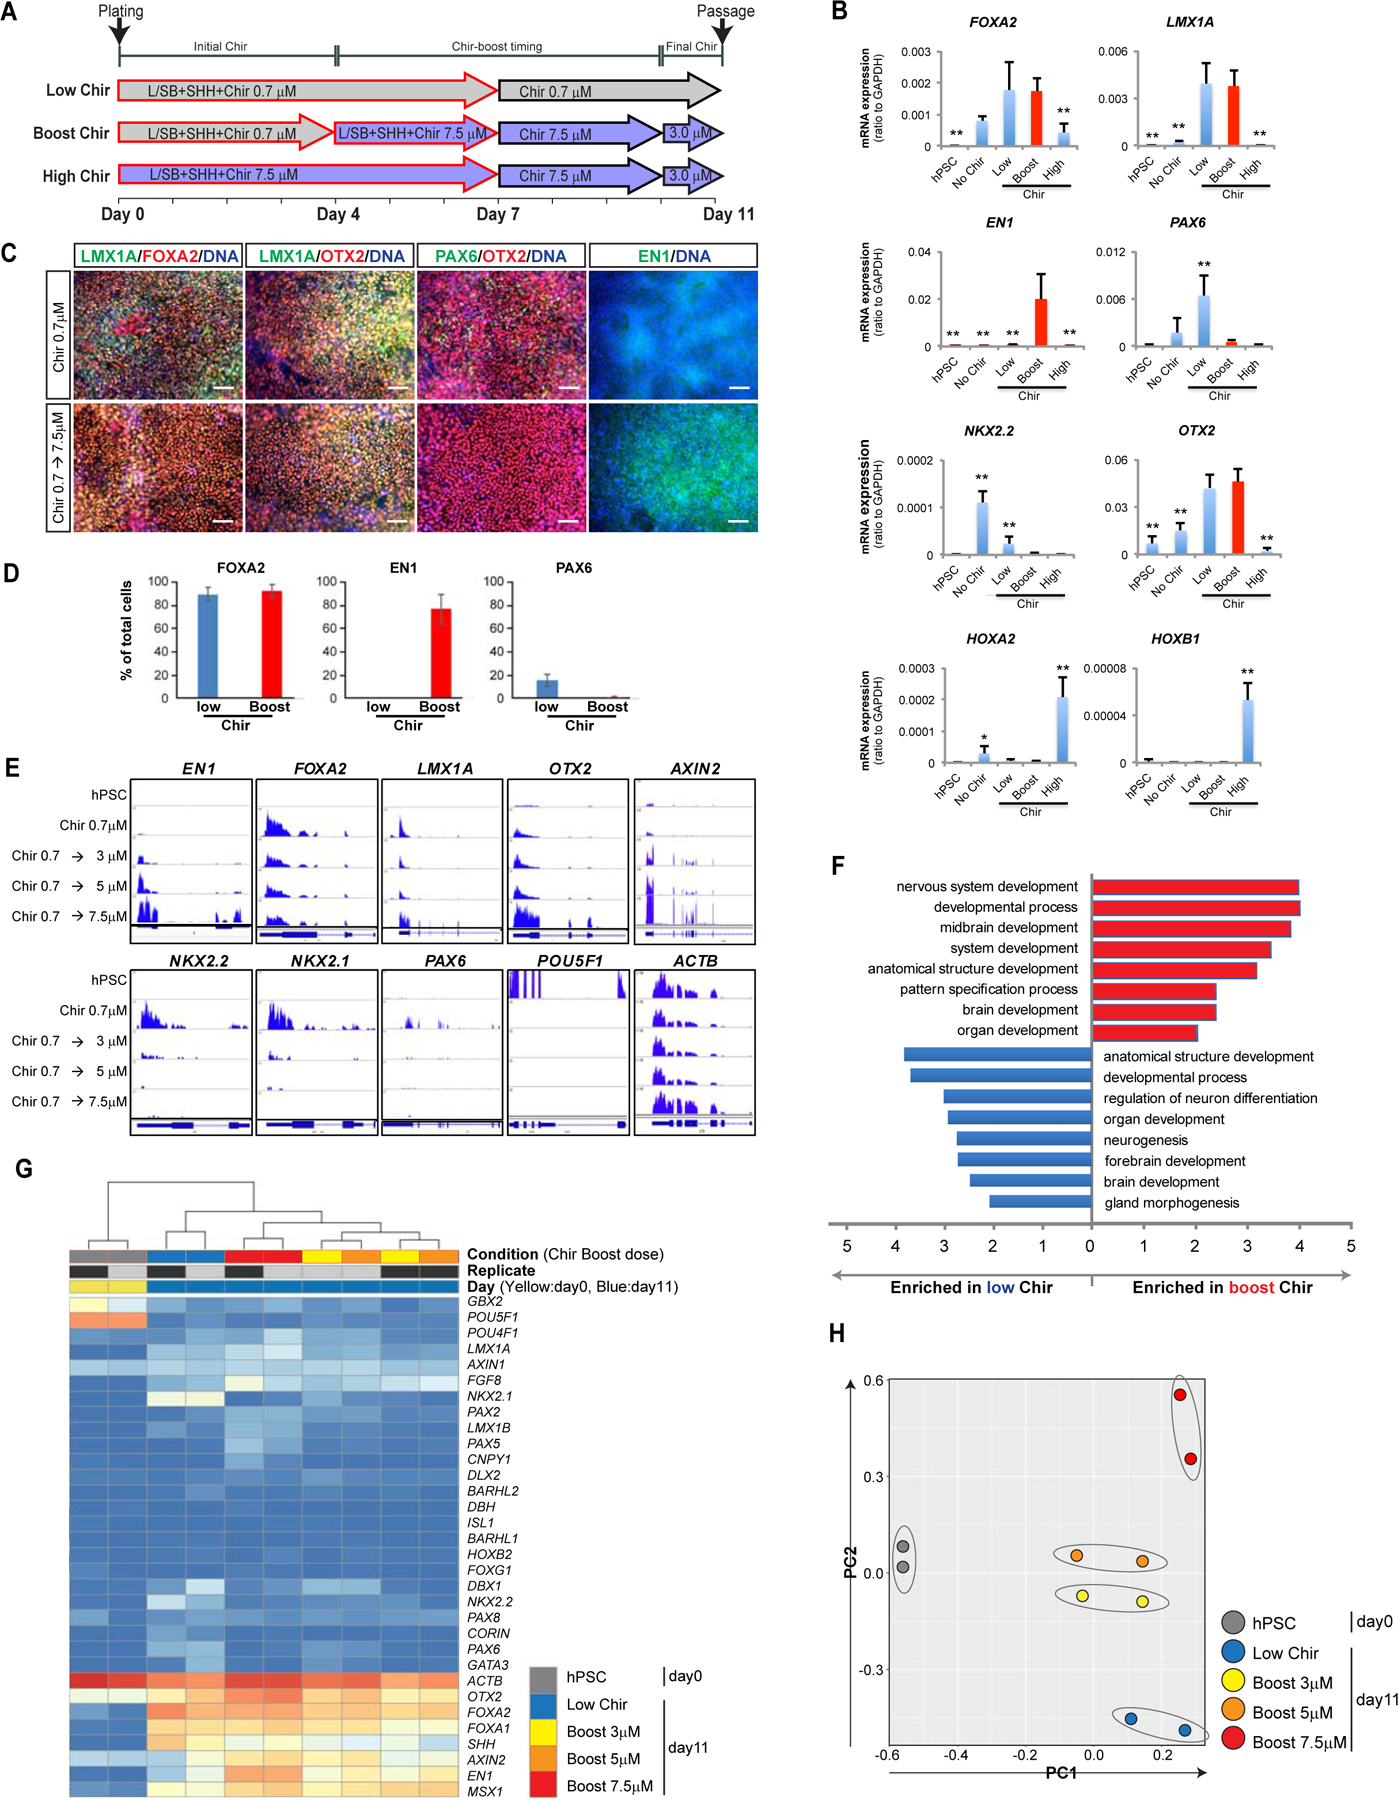
Figure 1. CHIR-boost effect on the induction of mDA and repression of non-mDA markers.

(A) Schematic illustration of the Low Chir, Boost Chir and High Chir culture conditions tested. (B) qRT-PCR analysis of hPSC-derived cells at day 11, Boost condition at 7.5µM. (C) Immuno-fluorescent staining of Low- and Boost- CHIR treated cells at day 11 of differentiation. Scale bars = 100 µm. (D) Quantification of the percentage of FOXA2+, EN1+ and PAX6+ cells at day 11 of differentiation following low Chir or Boost Chir treatment. (E) RNA sequencing data for key midbrain (upper row) and non-midbrain contaminating markers (lower row) are represented as tracks on human genome using IGV (integrative genomics viewer) (IGV). Chir 0.7µM is applied from day 0 to day 4, Chir boost dose from day 4 to day 10 and finally 3µM Chir from D10 (see timeline marked in (A)). Comparison of different concentrations of CHIR-boosting (day 4–10) measured at day 11. (F) Gene ontology (GO) analysis from RNA-sequencing between Low- and Boost- Chir conditions at day 11. (G) Heat map view of selected gene sets from RNA sequencing of hPSC and mDA differentiated cells with different CHIR-boosting at day 11. The unit of the color in each gene are log(TPM+1). Blue is low transcript while red color is high transcript. (H) PCA analysis of selected mDA genes from RNA-sequencing among hPSC and different CHIR-boost conditioned cells at day 11.
