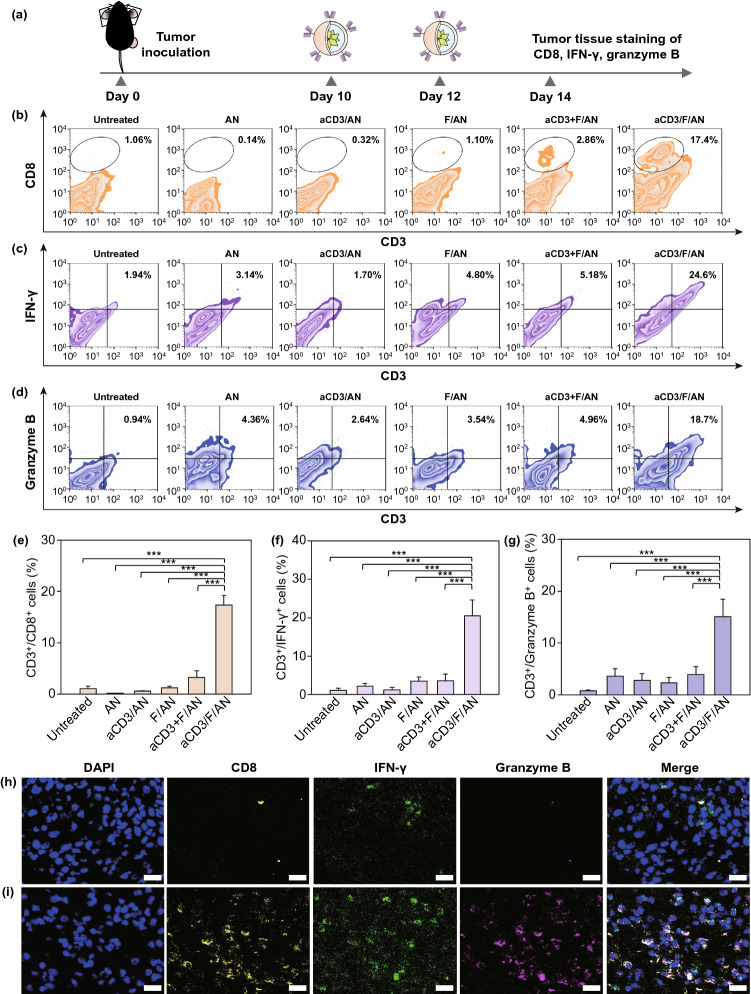
Fig. 11.
In vivo cytokine production by T cells in tumor tissues. a B16F10 tumor-bearing mice were injected with nanoparticle preparations on days 10 and 12 after tumor inoculation. On day 14, tumor tissues were extracted for analysis. b-d Infiltrating CD8+ T cells (b), IFN-γ–expressing T cells (c) and granzyme B–expressing T cells (d) among tumor tissue CD3+ T cells, determined by flow cytometry (***P < 0.001). Populations of CD3+/CD8+ cells (e), CD3+/ IFN-γ+ cells (f) and CD3+/granzyme+ cells (g) are shown. h, i In untreated (h), and aCD3/F/AN-treated mice (i), tumor tissues were extracted and immunostained with anti-CD8 (yellow), anti-IFN-γ (green) and anti-granzyme B (light purple) antibodies and counterstained with DAPI. Scale bar: 20 μm

