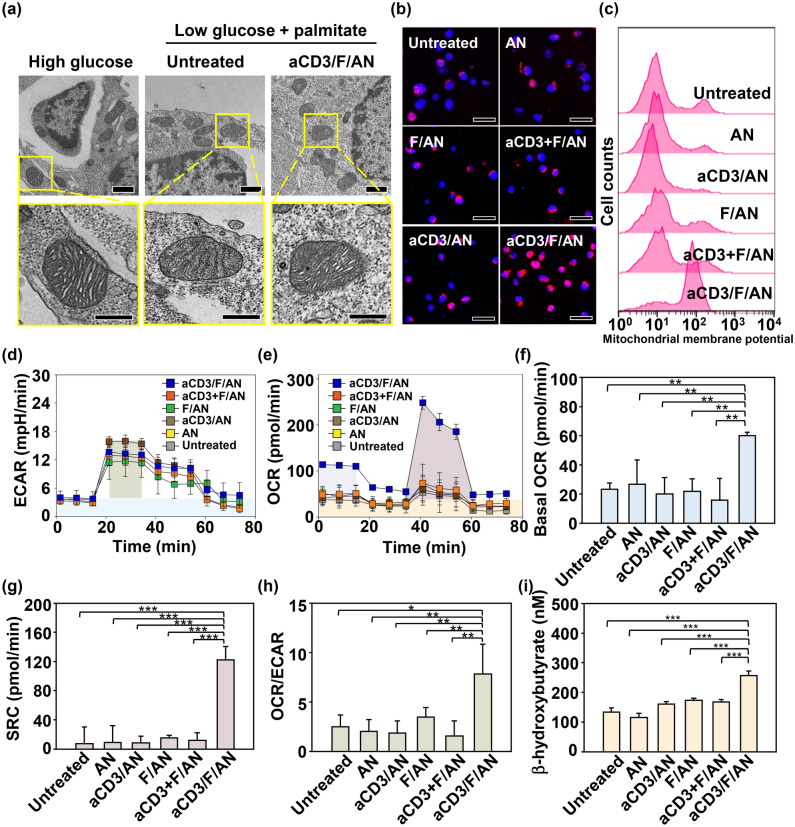
Fig. 5.
Mitochondrial morphology, membrane potential and fatty acid metabolism in T cells. T cells were treated with aCD3/F/ANs in low-glucose medium supplemented with palmitate as a lipid source. a TEM showing mitochondria of T cells in high-glucose medium, low-glucose medium untreated or treated with aCD3/F/AN. Scale bar: 1 μm (upper panels) and 500 nm (lower panels). b Mitochondrial membrane potential, assessed using MitoTracker Orange CMTMRos and visualized by confocal fluorescence microscopy. c Populations of T cells with increased mitochondrial membrane potentials, quantified by flow cytometry. d, e ECAR (d) and OCR (e), measured using a Seahorse XFp analyzer. f–h Basal OCR (f), SRC (g) and OCR/ECAR h values, obtained based on ECAR and OCR values (*P < 0.05, **P < 0.01). i β-Hydroxybutyrate secretion levels (***P < 0.001)

