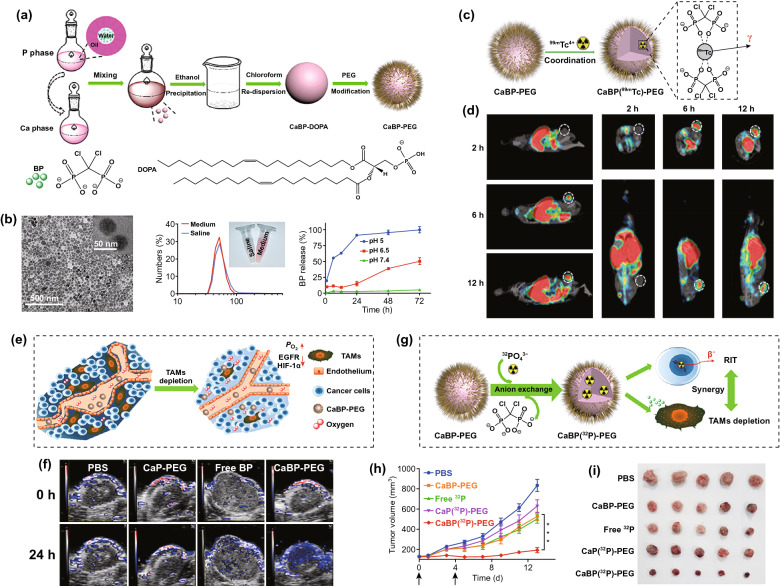
Fig. 12.
a Schematic illustration to show the preparation of CaBP nanoparticles. b TEM image and dynamic light scattering data and photo of CaBP-PEG nanoparticles in PBS and cell culture medium buffer, as well as release of BP from CaBP-PEG nanoparticles under different pH values. c Scheme illustrating the 99mTc radiolabeling of CaBP-PEG nanoparticles for tracing the in vivo fate of nanoparticles. d SPECT images of mice at 2, 6, and 12 h after intravenous injection of CaBP(99mTc)-PEG nanoparticles. Tumors of mice are highlighted by the dotted circles. e Scheme showing the normalized tumor vasculature, enhanced perfusion, and relieved tumor hypoxia after TAM depletion. f Scheme illustrating CaBP(32P)-PEG nanoparticles for synergistic combination RIT with TAM depletion. g Photoacoustic imaging showing tumor saturated O2 levels of mice after i.v. injection of PBS, CaP-PEG, free BP, or CaBP-PEG nanoparticles. h Tumor volume curves of mice with various treatments. Doses for each injection: 100 μCi of 32P, 200 μg of BP. The mice were treated twice at day 0 and 4 (black arrows). i Photographs of tumors collected on the 14th day after the first treatment.
Reproduced with permission from Ref. [320]

