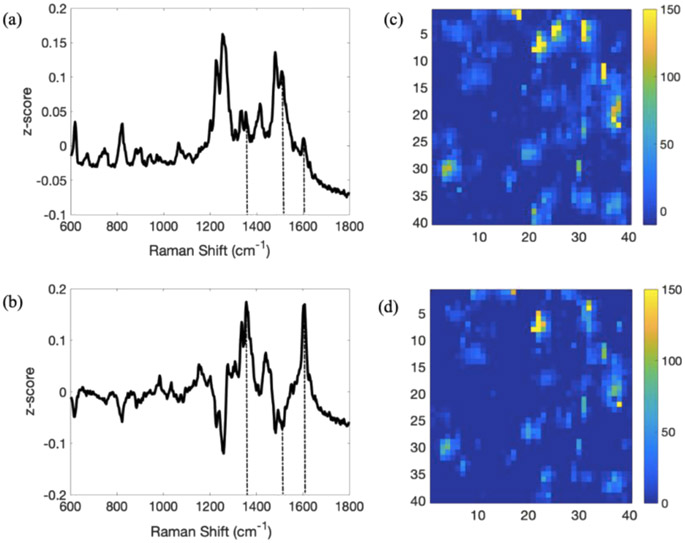
Figure 3.
PCA of the SERS images from a 120 h PA14 wt pellicle biofilm. (a,b) are PC1 and PC2 loading plots produced from the SERS image. Significant features at 1355, 1511, and 1603 cm−1 are marked with dashed vertical lines. (c,d) Heat maps of PC1 and PC2, respectively. The images in (c,d) are 10 μm X 10 μm.

