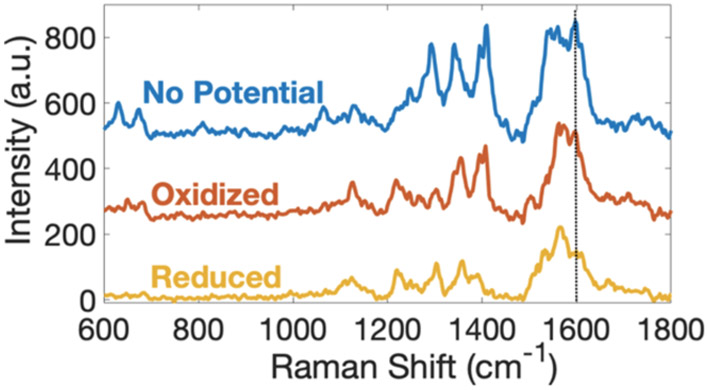
Figure 5.
SERS spectra of 120 h PA14 wt pellicle biofilms under EC potential control. 0.0 and −0.6 V potentials vs Ag/AgCl were applied to achieve oxidized and reduced conditions, respectively. All spectra were obtained at an integration time of 0.5 s with 10 accumulations, and potentials were applied for 20 s.

