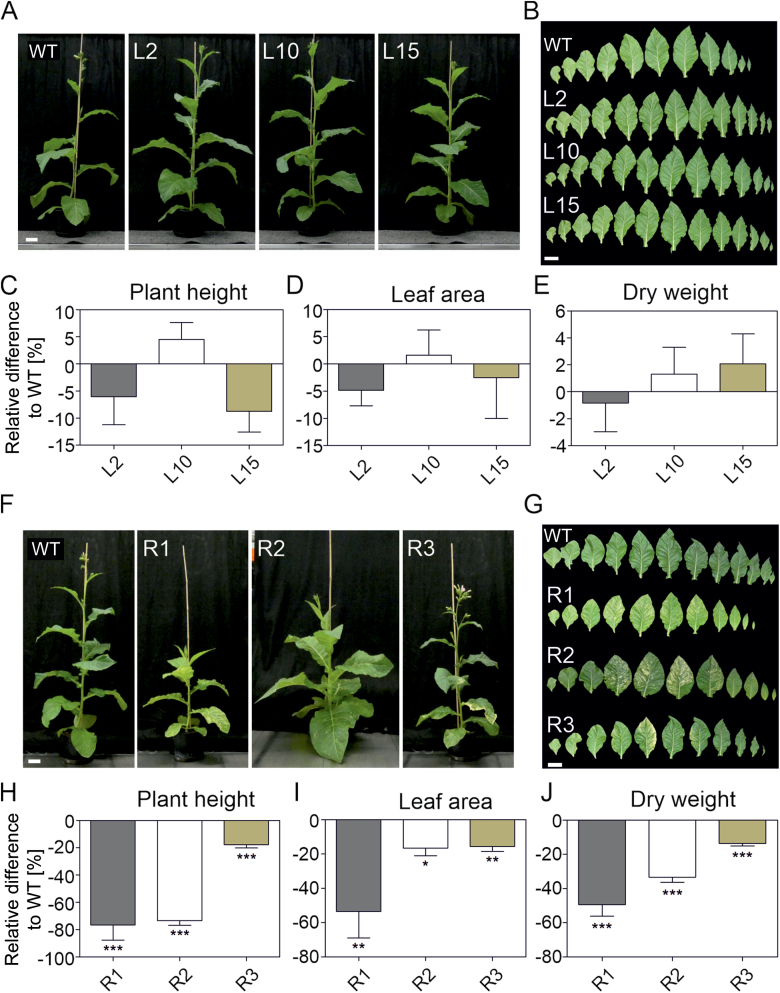
Fig. 4.
Plant productivity of transplastomic DcLCYB1 and NtLCYB RNAi lines. (A) Side view of 5-week-old wild type and transplastomic tobacco plants. (B) Leaf series of 5-week-old wild type and transplastomic lines. (C–E) Plant height, leaf area, and dry weight biomass of 4-week-old transplastomic plants. (F) Side view of 5-week-old wild type and RNAi tobacco plants. (G) Leaf series of 5-week-old wild type and RNAi lines. (H–J) Plant height, leaf area, and dry weight biomass of 4-week-old RNAi plants. Columns and bars represent the means and SEM of five biological replicates. Unpaired two-tailed Student’s t-test was performed to compare transgenic lines with the wild type. *P<0.05, **P<0.001, ***P<0.0001. Scale bar: 10 cm. WT, wild type.

