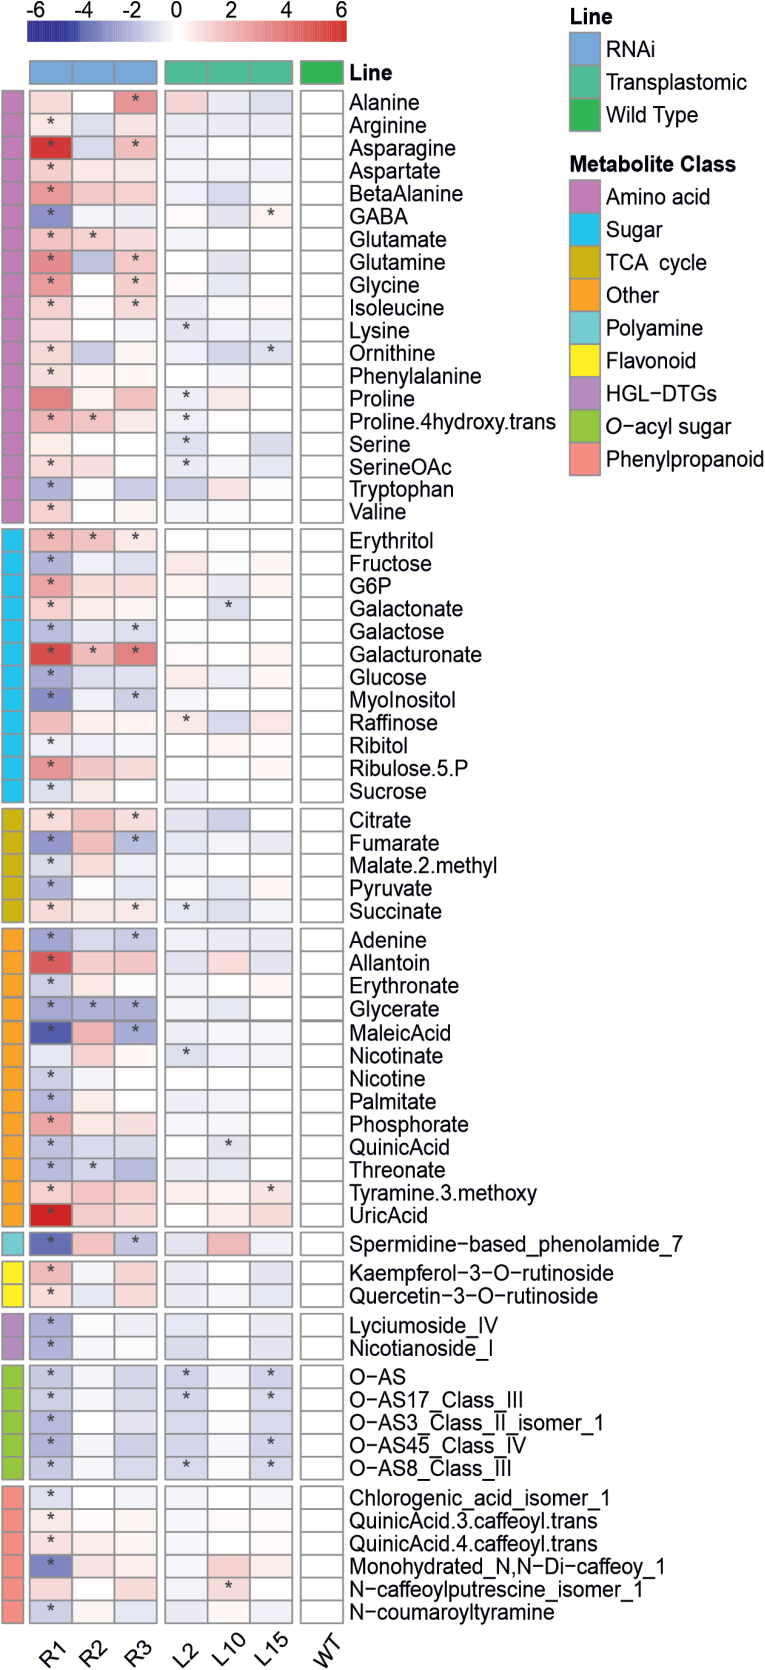
Fig. 7.
Metabolite content in transplastomic DcLCYB1 and NtLCYB RNAi lines. Heat map of metabolite content for transplastomic and RNAi lines. Only metabolites with significant changes for at least one line are shown. Results are reported as log2-fold changes relative to the wild type. Statistical analysis was performed in R (R Core Team, 2018) using an unpaired Wilcoxon test with the default parameters within the function compare_means of the ggpubr package (Kassambara, 2018). WT, wild type.

