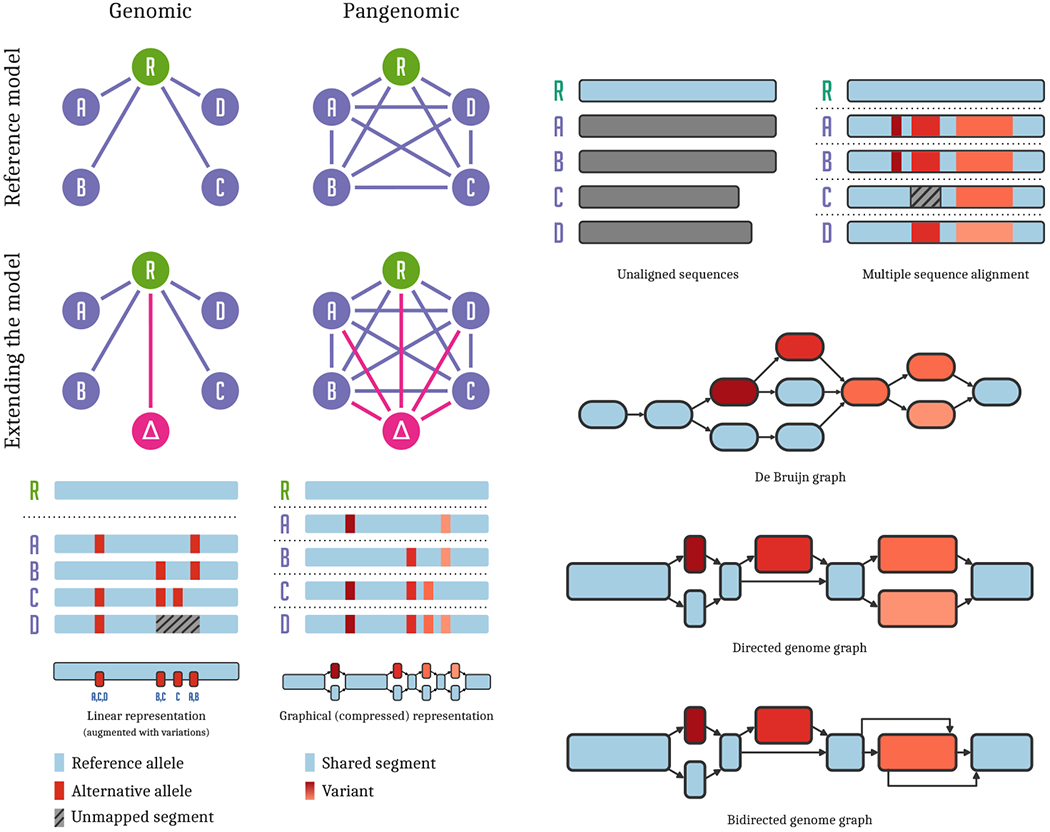
Figure 1:

Pangenomic models. Left panel: top left: In reference based genomic analyses, all genomes (A…D) are compared to each other via their relationship to the reference genome R. top right: In a pangenomic setting, we attempt to model direct relationships between all the genomes in our analysis, of which a particular reference R is chosen arbitrarily. middle left: When extending our analysis with a new genome, Δ, we add it to the genomic model by comparing it to reference R. middle right: In contrast, adding a new genome to a pangenomic analysis compares it directly with all other genomes in the model. bottom left: Regions of some genomes are unalignable against the reference, and cannot be represented in a list of variants. bottom right: A graphical model of the genomes allows direct all-to-all comparison, capturing all of their sequence relationships. Right panel: top left: A collection of sequences representing a pangenome. top right: Multiple sequence alignment of the sequences captures their mutual relationships. middle top: In a de Bruijn graph, sequences are represented without bias, but variants may correspond to larger graph structures. middle bottom: An acyclic sequence graph is equivalent to the multiple sequence alignment. bottom: A generic sequence graph can represent a structural variant (in orange, right) compactly, using edges between the forward and reverse strands of the graph to indicate the presence of an inversion.
