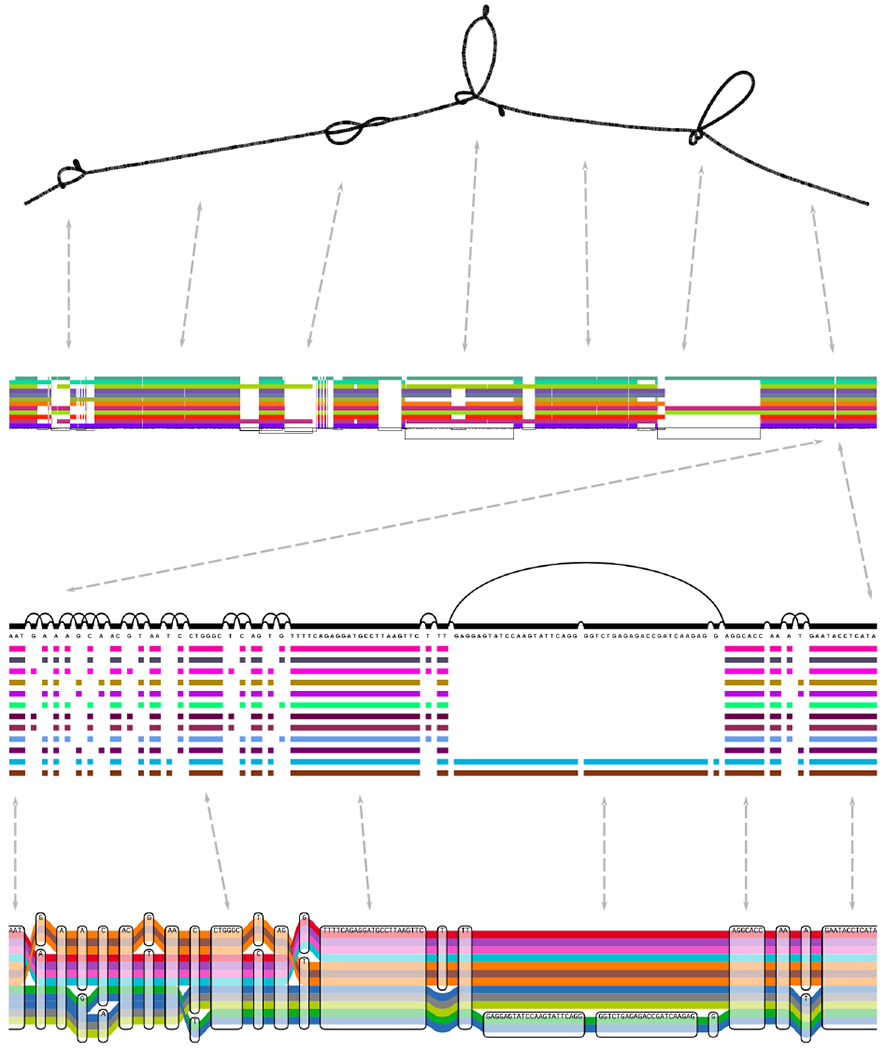
Figure 2:

Visualizing a graph of GRCh38 and its alternate sequences in the gene HLA-DRB1 built with VG msga (48). Top: Bandage’s force directed layout reveals large scale structures (142). Top middle: ODGI viz’s binned, linearized rendering of the paths (colored bars) versus the sequence and topology of the graph (below). Bottom middle: A fragment of VG viz’s linearized rendering, showing base-level detail. Bottom: The same fragment rendered with the Sequence Tube Map (13). Dashed lines show correspondence between the visualizations. Path colors are assigned independently by each method.
