

Abstract
Genes and environment interact during intrauterine life, and potentially alter the developmental trajectory of the brain. This can result in life-long consequences on brain function. We have previously developed two transgenic mouse lines that suppress Gad1 expression in parvalbumin (PVALB) and neuropeptide Y (NPY) expressing interneuron populations using a bacterial artificial chromosome (BAC)-driven miRNA-based silencing technology. We were interested to assess if maternal immune activation (MIA), genetic interneuronal inhibition, and the combination of these two factors disrupt and result in long-term changes in neuroinflammatory gene expression, sterol biosynthesis, and acylcarnitine levels in the brain of maternally exposed offspring. Pregnant female WT mice were given a single intraperitoneal injection of saline or polyinosinic–polycytidilic acid [poly(I:C)] at E12.5. Brains of offspring were analyzed at postnatal day 90. We identified complex and persistent neuroinflammatory gene expression changes in the hippocampi of MIA-exposed offspring, as well in the hippocampi of Npy/Gad1 and Pvalb/Gad1 mice. In addition, both MIA and genetic inhibition altered the post-lanosterol sterol biosynthesis in the neocortex and disrupted the typical acylcarnitine profile. In conclusion, our findings suggest that both MIA and inhibition of interneuronal function have long-term consequences on critical homeostatic mechanisms of the brain, including immune function, sterol levels, and energy metabolism.
Keywords: maternal immune activation, interneuron, neuroinflammation, sterol profile, acylcarnitines, schizophrenia
Graphical Abstract

INTRODUCTION
Interneurons represent a diverse population, with distinct neuropeptide content, anatomical features, electrophysiological properties, and connectivity (Benes and Berretta, 2001; DeFelipe et al., 2013; Fishell and Kepecs, 2019; Lim et al., 2018; Petilla Interneuron Nomenclature et al., 2008; Tremblay et al., 2016). Their function is primarily mediated through γ-aminobutyric acid (GABA) (Bryson et al., 2020; Swanson and Maffei, 2019), an inhibitory neurotransmitter, which is predominantly synthesized by the GAD67 protein encoded by the Gad1 gene (Bu and Tobin, 1994). Interneurons synchronize and modulate neuronal networks (Gonzalez-Burgos et al., 2015), and their normal function is essential for cognitive processing (Dienel and Lewis, 2018).
Neuropeptide Y (NPY) and parvalbumin (PVALB) containing interneurons are non-overlapping subpopulations, with distinct anatomical and physiological characteristics. NPY+ interneurons are neurogliaform cells that primarily signal through non-synaptic volume transmission and Martinotti cells that synapse onto dendrites (Corder et al., 2018; Karagiannis et al., 2009). PVALB-expressing interneurons make up ~50% of the neocortical interneuron population and come in two main varieties: fast-spiking basket and chandelier cells that innervate pyramidal neuron soma and axon initial segments, respectively (Hu et al., 2014). Neocortical PVALB+ neurons synchronize cortical gamma oscillations in mice, and these oscillations are believed to be essential for normal working memory in humans (Gonzalez-Burgos and Lewis, 2012; Lewis et al., 2011).
Environmental stressors exert their effects on interneuron development (Garbett et al., 2012), and PVALB-positive interneurons appear to be the most vulnerable. Maternal immune activation (MIA) (Meyer, 2019; Mueller et al., 2020; Shi et al., 2003; Smith et al., 2007) leads to selective anatomical and functional vulnerability of PVALB+ interneurons (Canetta et al., 2016), and impaired positioning of GABAergic interneurons in the developing cortex (Vasistha et al., 2019).
Major psychiatric disorders are characterized by disturbances in multiple molecular and biochemical domains, including neurotransmitter expression, synaptic transmission, cellular energy metabolism, and neuroinflammatory processes (Horvath and Mirnics, 2014; Horvath and Mirnics, 2015; Kim et al., 2017; Mirnics et al., 2000; Zuccoli et al., 2017). Importantly, reduced expression of the Gad1 gene-encoded 67-kDa protein isoform of glutamic acid decarboxylase (GAD67) is a hallmark of multiple neuropsychiatric disorders, including schizophrenia (Michel et al., 2012), bipolar disorder, anxiety disorders, autism (Hashemi et al., 2016; Schmidt et al., 2013), and depression. Multiple human disorders, including schizophrenia and major depression, are also characterized by strong neuroinflammatory signatures in the brain (Brown et al., 2014; Cieslik et al., 2020; Kalman et al., 2014; Melo et al., 2019). In addition, recent studies of patients with schizophrenia revealed a disrupted acylcarnitine profile in the plasma of patients (Cao et al., 2019).
We have previously developed two transgenic mouse lines that suppress Gad1 transcript (and GAD67 expression) in PVALB+ and NPY+ interneuron populations using a bacterial artificial chromosome (BAC)-driven miRNA-based silencing technology (Garbett et al., 2010). These Npy/Gad1 and Pvalb/Gad1 transgenic mice exhibit distinct, complex behavioral phenotypes that have been reported previously (Brown et al., 2015; Schmidt et al., 2014).
Based on the data from the literature (Canetta et al., 2016; Vasistha et al., 2020) and the availability of transgenic mouse models we developed (Brown et al., 2015; Garbett et al., 2010; Schmidt and Mirnics, 2012; Schmidt et al., 2014), we asked the following questions: 1) Are the neuroinflammatory gene expression, sterol, and acylcarnitine profiles altered in the MIA –treated mice? 2) Are the same experimental readouts altered in the Pvalb/Gad1 and Npy/Gad1 mice we previously generated? 3) Do MIA and genetic inhibition interact and potentiate disrupted neuroinflammatory gene expression, sterol, and acylcarnitine changes?
RESULTS
Neuroinflammatory gene expression changes in response to genetic inhibition of interneurons and maternal immune activation
Neuroimmune disturbances of multiple neuropsychiatric disorders are integral part of the disease pathophysiology (Liberman et al., 2018). We wanted to test a link between neuroimmune changes and interneuron function by assessing the long-term effects of genetic interneuron inhibition, maternal immune activation, and the combination of both on brain gene expression. To achieve this, we performed neuroimmune gene expression profiling by Nanonstring analysis on 48 individual hippocampi of P90 mice of three genotypes (WT, Npy/Gad1 and Pvalb/Gad1) that were maternally exposed to poly(I:C) or saline at age of E12.5.
To achieve this, seven comparisons were performed: 1) WT-SAL vs. WT-poly(I:C); 2) WT-SAL vs. Npy/Gad1-SAL; 3) Npy/Gad1-SAL vs. Npy/Gad1-poly(I:C); 4) WT-poly(I:C) vs. Npy/Gad1-poly(I:C); 5) WT-SAL vs. Pvalb/Gad1-SAL; 6) Pvalb/Gad1-SAL vs. Pvalb/Gad1-poly(I:C), and 7) WT-poly(I:C) vs. Pvalb/Gad1-poly(I:C) (Figure 1 and Supplemental Material 1). Genes were considered differentially expressed if a normalized expression count showed a >20% change in expression level and a statistical significance of p<0.05.
Figure 1. Summary of neuroimmune gene expression changes.
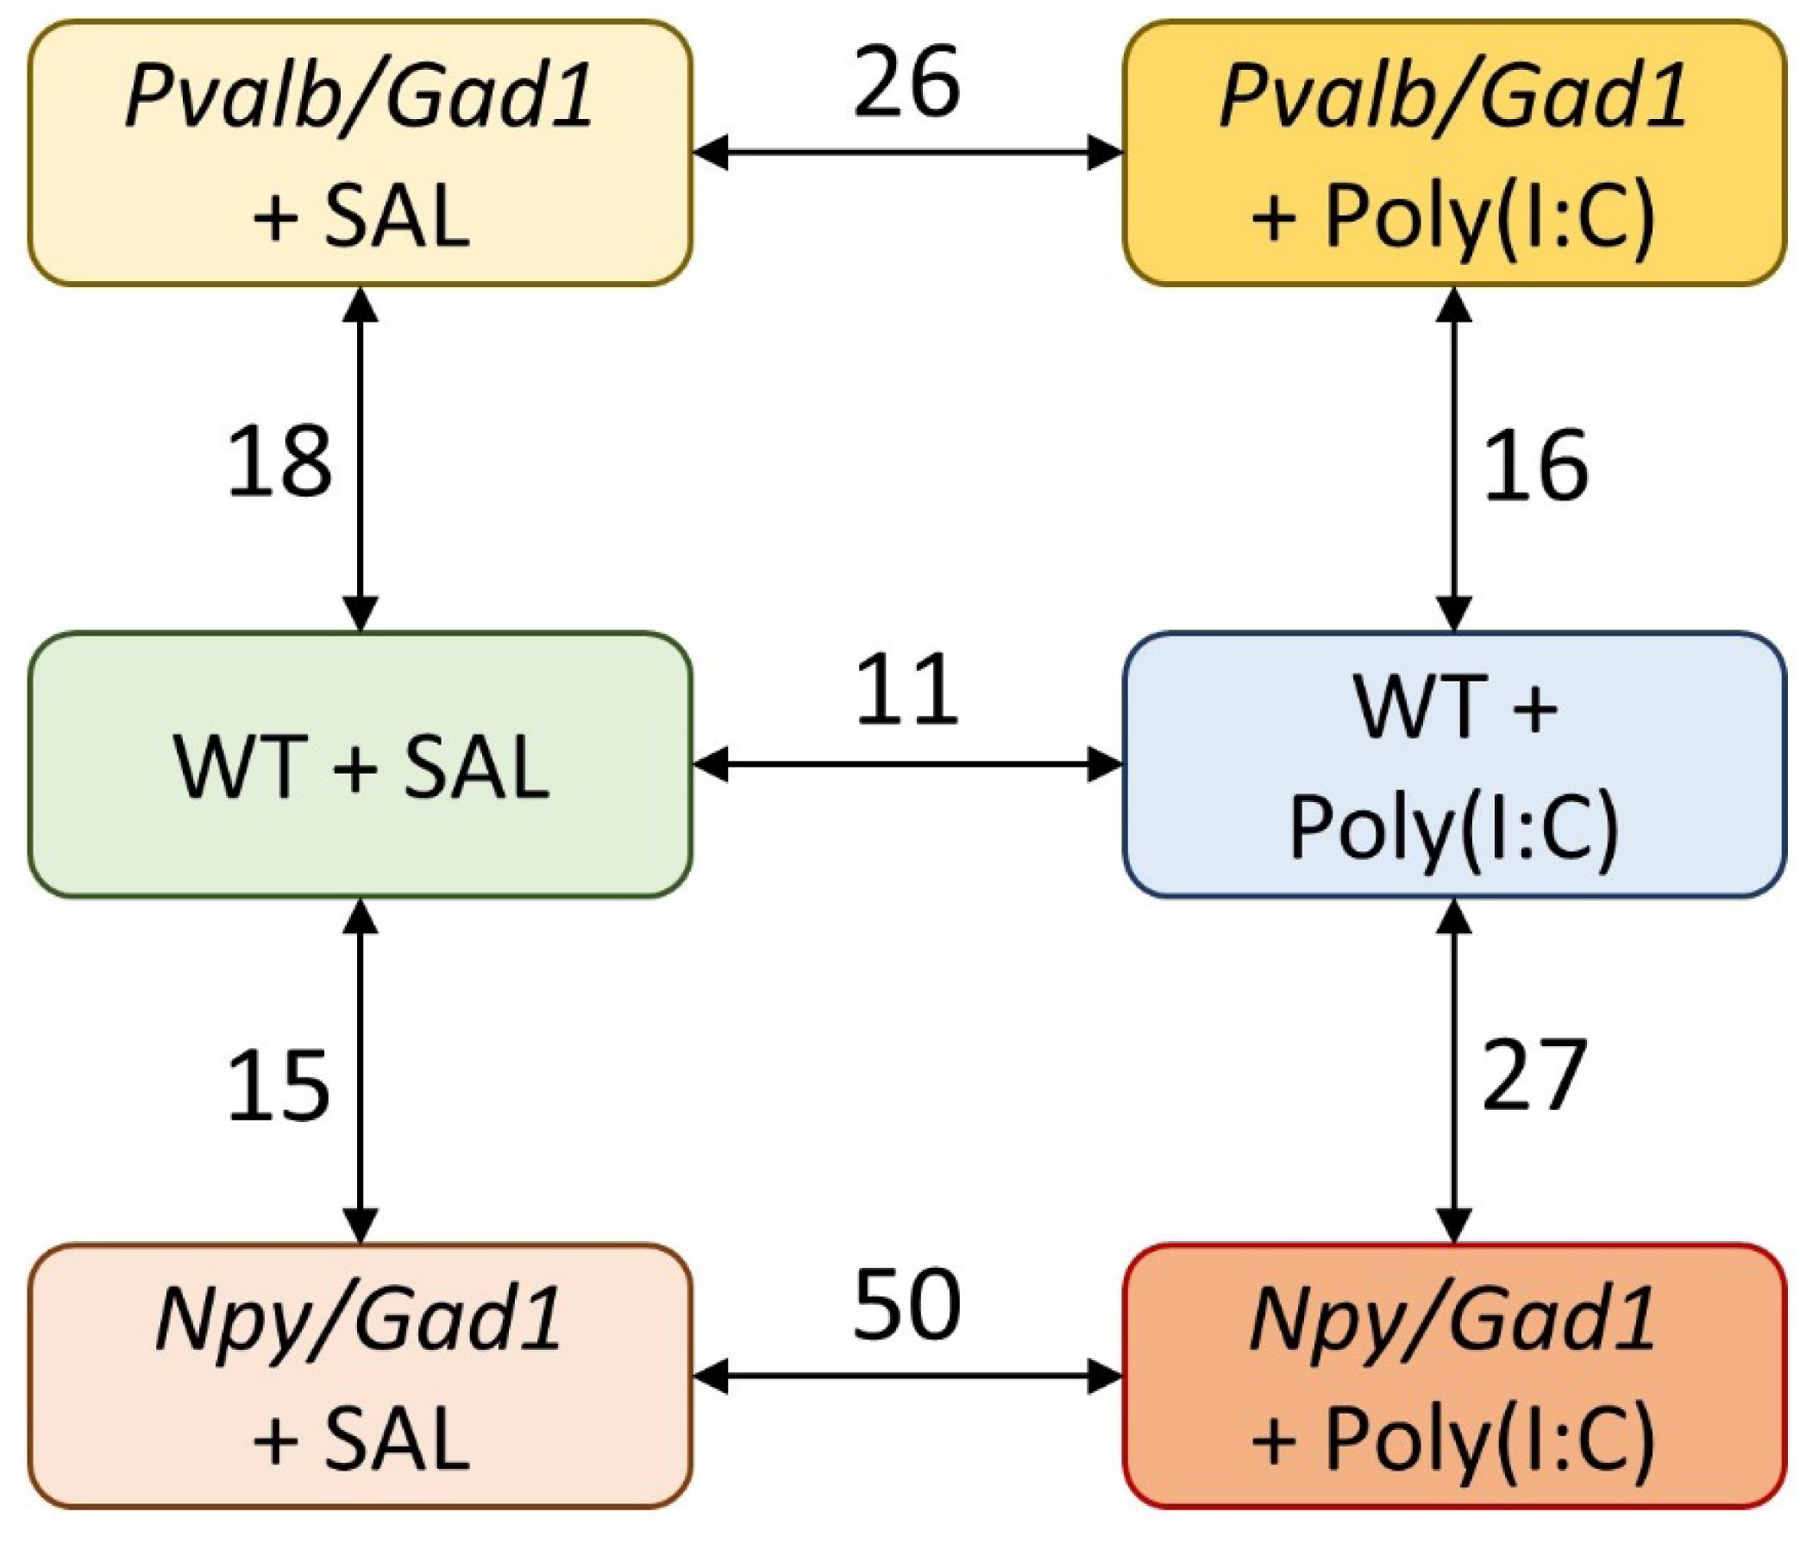
Arrows denote the performed comparisons, numbers denote the gene transcripts showing differential expression between the two groups. Note that both genetic inhibition and intrauterine poly(I:C) treatment lead to gene expression changes that persist into adulthood, and the largest number of gene expression changes are observed when the two insults are combined. SAL – saline-treated; NPY – neuropeptide Y; PVALB – parvalbumin; GAD1 – glutamic acid decarboxylase 1; poly(I:C) - polyinosinic:polycytidylic acid.
Poly(I:C) effect.
Poly(I:C) is structurally similar to double-stranded viral RNA and has a strong immunostimulant effect through endosomal Toll-like receptor 3 (Alexopoulou et al., 2001). Maternal exposure to poly(I:C) results in immune system activation that mimics viral infection, with deleterious consequences for the developing brain of the offspring (Garbett et al., 2012; Michel et al., 2012). A spectrum of structural and behavioral abnormalities related to psychiatric disorders can be recapitulated in rodents by inducing MIA using this viral mimetic, including, but not limited to, long-lasting deficits in PVALB+ interneurons (Canetta et al., 2016). Importantly, prenatal immune challenge during early/middle and late fetal development in mice leads to distinct brain and behavioral pathological symptom clusters in adulthood (Meyer et al., 2008). Over the last two decades maternal exposure to poly(I:C) emerged as a powerful model to study the pathophysiological processes associated with neurodevelopmental disorders, including schizophrenia and autism (Bauman and Van de Water, 2020).
Our results revealed that maternal exposure to poly(I:C) alone had lasting effect on neuroimmune gene expression in the hippocampi at P90. Of the 757 assessed genes, we found that 11 genes showed differential transcript expression (1.4%). Of these, 2 genes were upregulated (0.2%), and 9 (1.2%) genes were downregulated (Supplemental Material 1). These genes were related to a variety of cellular functions. We found of particular interest the >1.2 fold upregulation of the Ral Guanine Nucleotide Dissociation Stimulator Like 1 (Rgl1) transcript, which has a function in small GTPase mediated signal transduction and regulation of lipid metabolic processes.
Genetic inactivation effect.
Inhibition of Gad1 in NPY+ neurons also had a persistent effect on the neuroimmune transcripts. Npy/Gad1 saline-treated transgenic mouse hippocampi showed 15 (2%) significant gene expression changes in comparison to WT saline treated mice (Figure 1, Supplemental Material 1). Of these, 5 transcripts were upregulated, and 10 were downregulated. In this group, the transcript of particular interest was the >50% upregulation of the central apoptosis-related protein Caspase 1 (Casp1). The Pvalb/Gad1 saline treated group also showed expression differences in the hippocampi in comparison to the WT saline treated group: 18 gene expression differences have been identified (2.4%), and all were downregulated in relation to the WT saline treated group (Figure 1, Supplemental Material 1). The downregulated transcripts included multiple critical neurodevelopmental and immune regulatory genes, including genes that putatively play a role in the neurodevelopmental events associated with autism and schizophrenia: Forkhead Box P3 (Foxp3), C-X-C Motif Chemokine Ligand 10 (Cxcl10), and Toll Like Receptor 2 (Tlr2).
Combined genetic*environmental effects –
Our results suggest that both Npy/Gad1 and Pvalb/Gad1 animals are particularly susceptible to the effects of maternal immune activation. Npy/Gad1 poly(I:C)-treated animals showed 50 altered transcripts (6.6%) in the hippocampi when they were compared to Npy/Gad1 saline-treated animals (Figure 1, Supplemental Material 1). Downregulated transcripts dominated in this comparison between the two groups (46/50). Perhaps some of the most intriguing gene expression changes we found were the increased expression of Heat Shock Protein Family B (Small) Member 1 (Hspb1) and Histone Deacetylase 4 (Hdac4), and reduced expression of the previously mentioned Foxp3, Cxcl10, and caspase 4 (Casp4). A two-way, unsupervised hierarchical clustering of log2 expression values, based on average linkage, perfectly separated out the Npy/Gad1 saline-treated animal hippocampi from the Npy/Gad1 poly(I:C)-treated animals (Figure 2).
Figure 2. Hierarchical clustering of gene expression changes between saline-treated and maternal poly(I:C)-treated Npy/Gad1 transgenic animal hippocampi at P90.
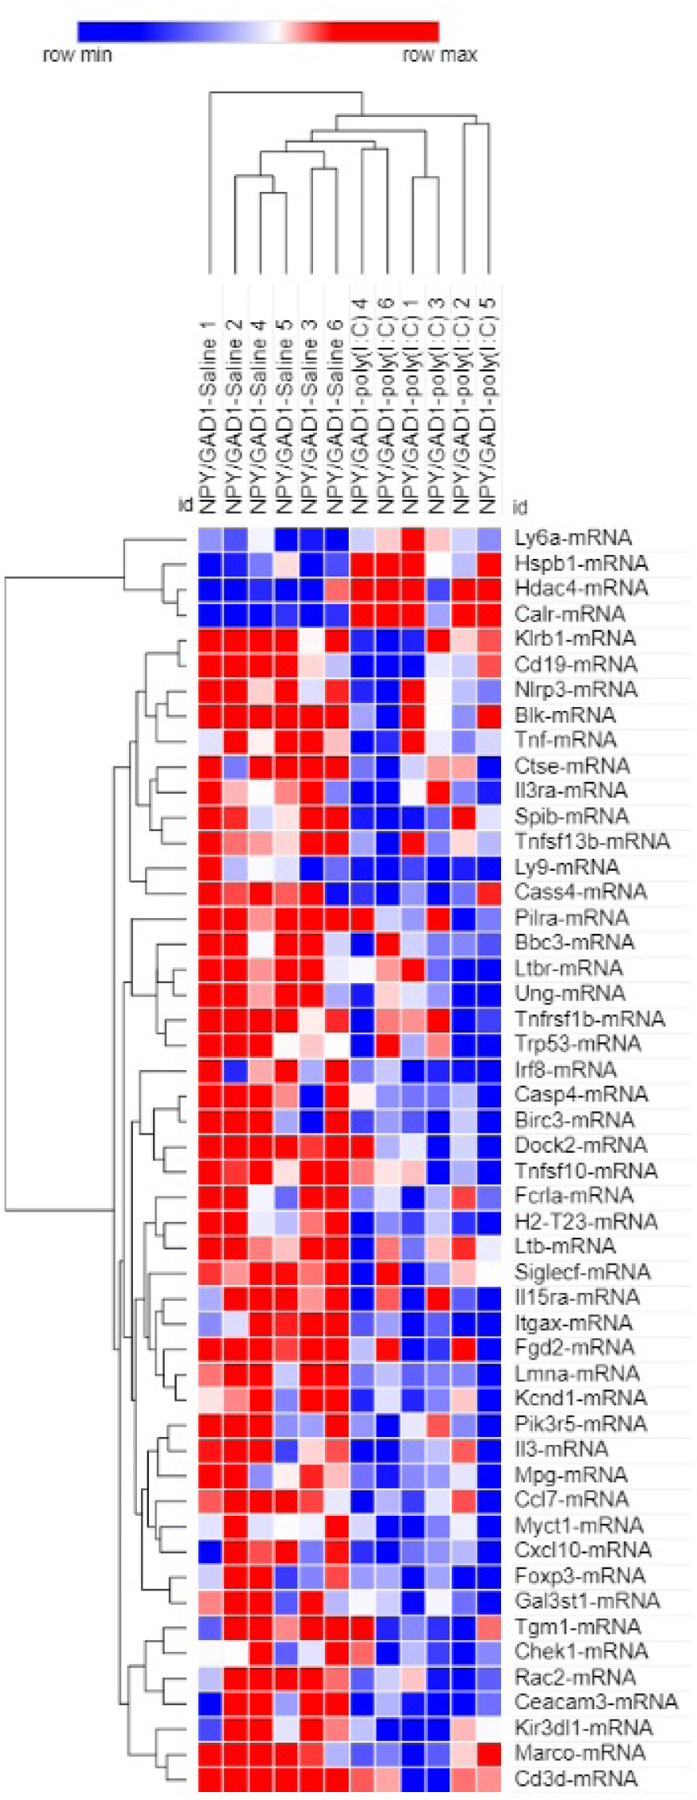
Two-way unsupervised hierarchical clustering was performed with the Morpheus software using average linkage on log2 expression values. Rows represent genes, columns represent samples. Each square represents normalized log2 expression level for a gene from a single experimental animal brain. Colors correspond to expression level versus the mean expression (red-increased; blue decreased). Color intensity corresponds to the magnitude of change. Note that the maternal saline-treated and maternal poly(I:C)-treated Npy/Gad1 animals are perfectly separated in the top dendrogram.
Pvalb/Gad1 poly(I:C)-treated animals showed 26 altered transcripts (3.3%) in the hippocampi when they were compared to Pvalb/Gad1 saline-treated animals (Figure 1, Supplemental Material 1). This comparison yielded very different results, with upregulations dominating in the gene expression changes. Of the 26 transcripts, 24 were upregulated, including Cxcl10, Tlr2, and Foxp3. A two-way, unsupervised hierarchical clustering of log2 expression values, based on average linkage, almost perfectly separated the Pvalb/Gad1 saline-treated and poly(I:C)-treated animals into two clusters (Figure 3).
Figure 3. Hierarchical clustering of gene expression changes between saline-treated and maternal poly(I:C)-treated Pvalb/Gad1 transgenic animal hippocampi at P90.
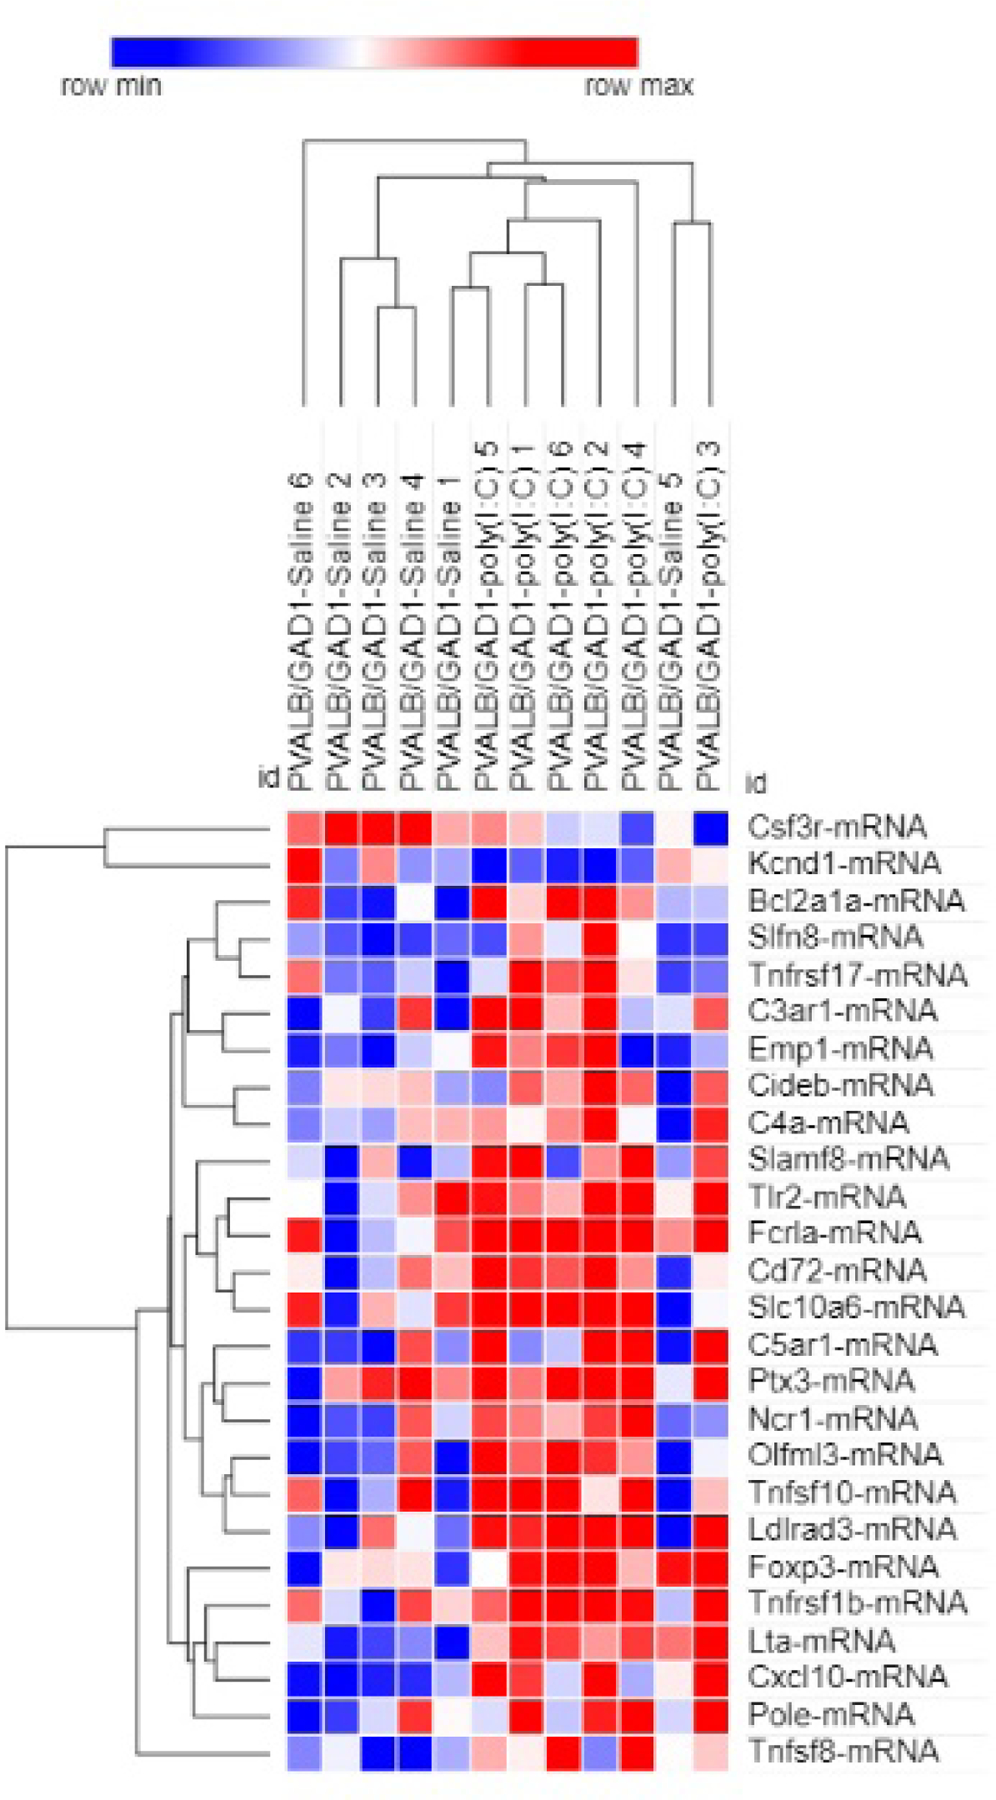
Two-way unsupervised hierarchical clustering was performed with the Morpheus software using average linkage on log2 expression values. Rows represent genes, columns represent samples. Each square represents normalized log2 expression level for a gene from a single experimental animal brain. Colors correspond to expression level versus the mean expression (red-increased; blue decreased). Color intensity corresponds to the magnitude of change. Note that the maternal saline-treated and maternal poly(I:C)-treated Pvalb/Gad1 animals are well separated in the top dendrogram, with one saline-treated sample as an outlier.
Maternal immune activation leads to long-term alterations in sterol biosynthesis in offspring neocortex
The brain synthesizes its own cholesterol from early development, which is independent from systemic cholesterol biosynthesis (Tint et al., 2006). The brain’s intrinsic cholesterol biosynthesis is essential for normal CNS function, and disruption of sterol biosynthesis is a well-documented finding in multiple developmental and major psychiatric disorders (Herman, 2003; Kavoor et al., 2017; Korade et al., 2009; Porter, 2008; Porter and Herman, 2011; Tomson-Johanson and Harro, 2018; Wassif et al., 2007). We hypothesized that both MIA, as well as our two transgenic models, will disrupt post-lanosterol sterol synthesis during development, and that these effects will persist into adulthood. Furthermore, we wanted to assess if the genetic and environmental insults can potentiate each other and further alter the brain’s post-lanosterol homeostasis. To establish the post-lanosterol sterol biosynthesis profile and assess the effect of MIA, genetics inhibition, and the combination of both, we performed LC-MS/MS analyses of cholesterol (CHOL), 7-dehydrocholesterol (7-DHC), desmosterol (DES), and lanosterol (LAN) levels in a total of 153 neocortical samples.
A multifactorial ANOVA analysis of the Npy/Gad1 experimental group (WT-saline [n=24]; WT-poly(I:C) [n=20]; Npy/Gad1-saline [n=27]; Npy/Gad1-poly[I:C] [n=11]) revealed that poly(I:C) treatment significantly altered the sterol biosynthesis profile. Follow-up inter-group magnitude comparisons revealed reduced levels in CHOL and DES (7.1% and 20% change for CHOL and 6% and 24.3% change for DES in poly(I:C)-treated WT and poly(I:C)-treated Npy/Gad1, respectively), while Npy/Gad1 genotype alone reduced CHOL (6.9% change), and DES (7% change) (Figure 4). Importantly, while both factors (genetic and MIA) resulted in long-term changes in sterol biosynthesis, based on multifactorial ANOVA analyses the two factors did not potentiate each other. In addition, we found no statistically significant differences between male and female animals.
Figure 4. Sterol profile changes between saline-treated and maternal poly(I:C)-treated Npy/Gad1 transgenic and WT animal neocortices at P90.
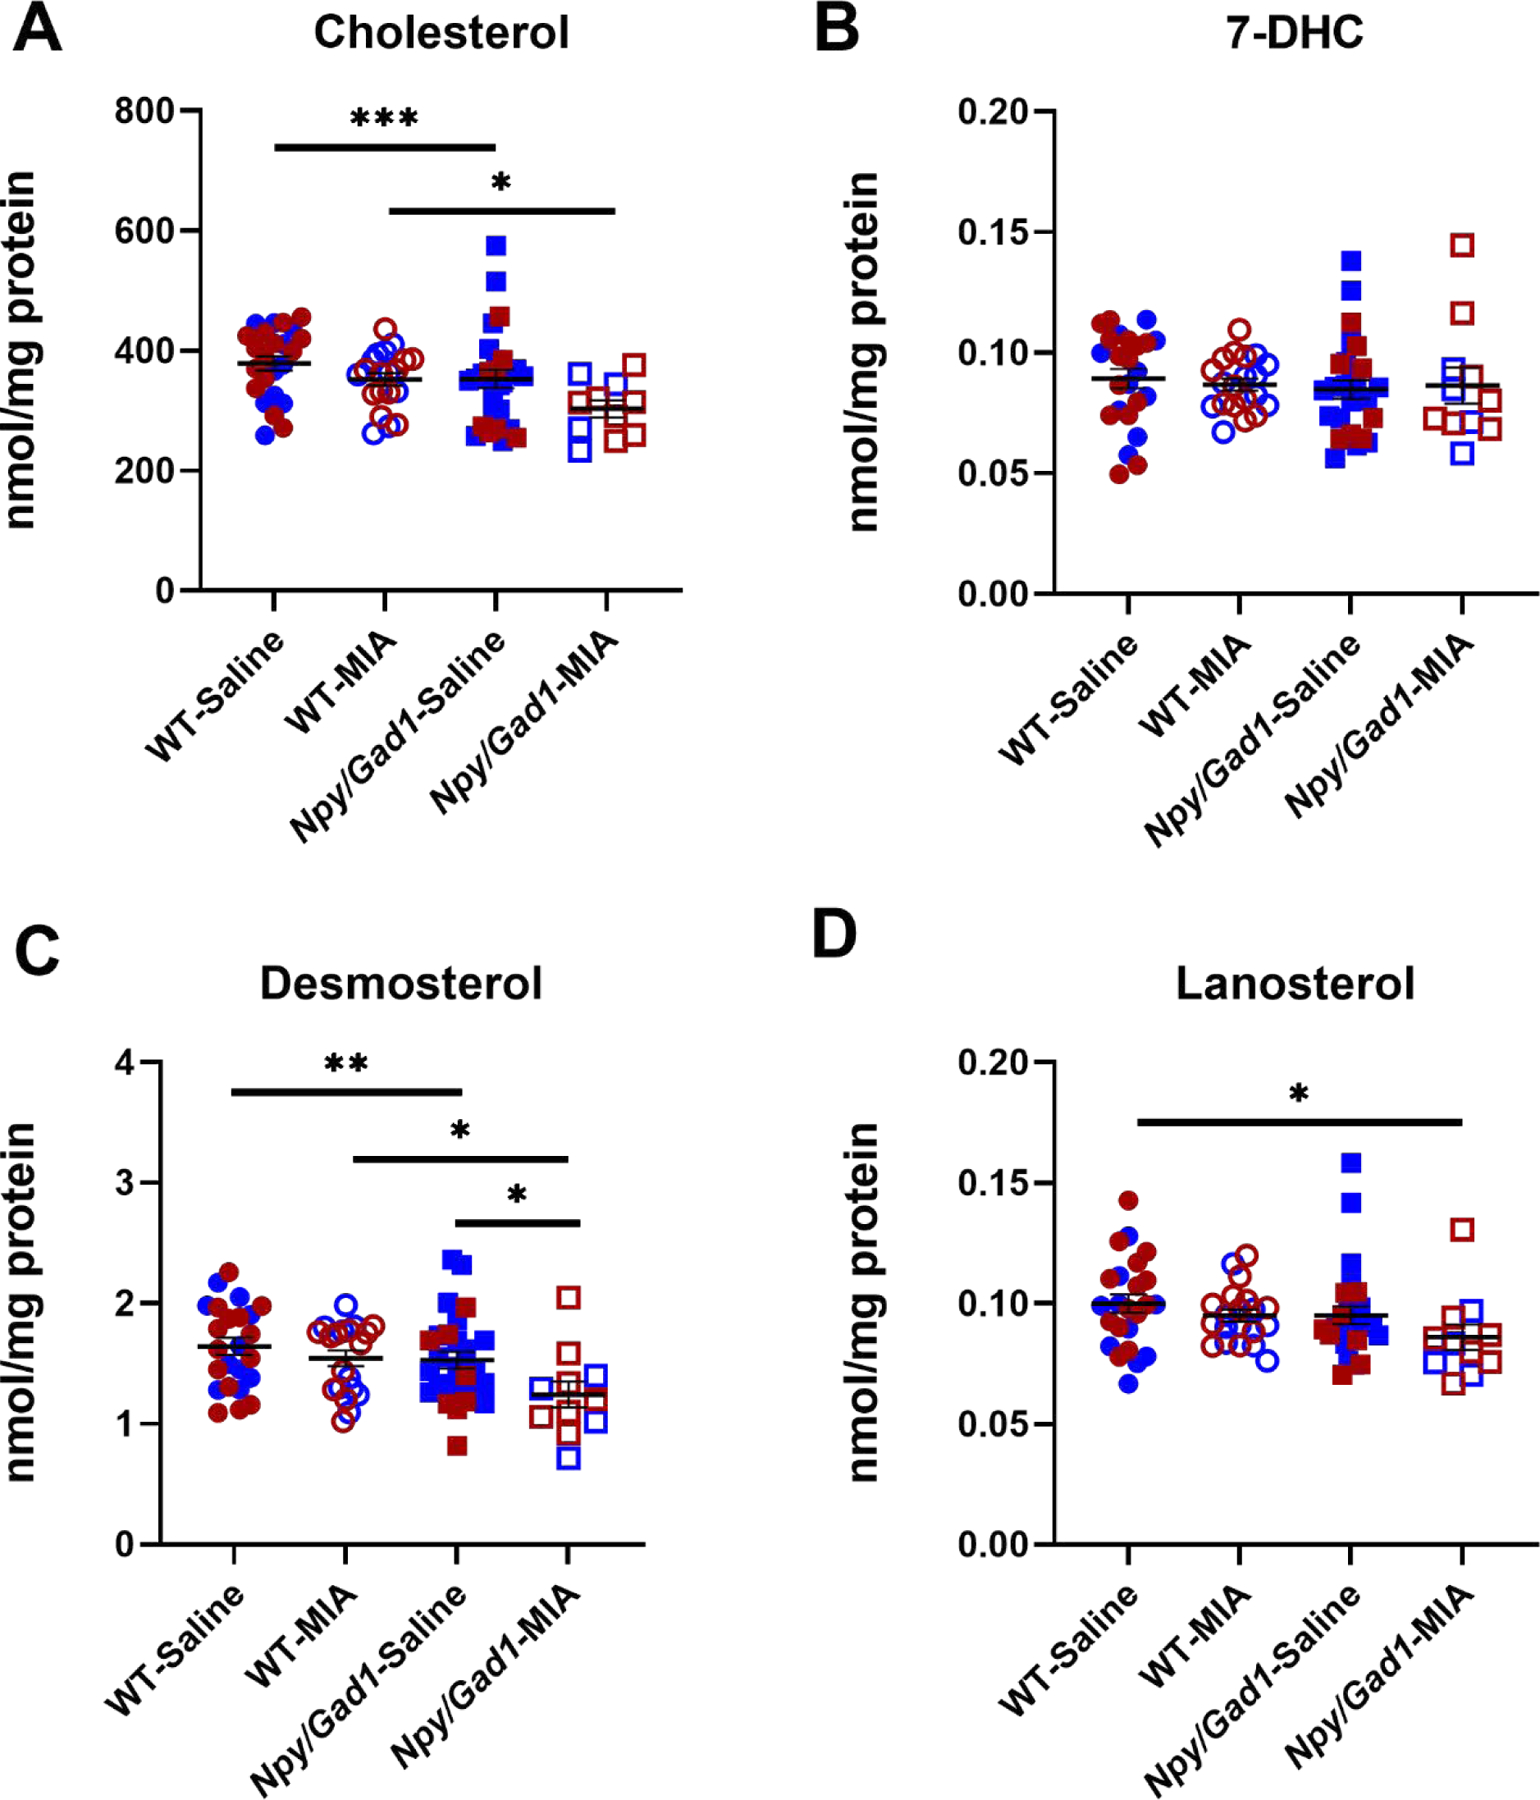
A) CHOL, B) 7-DHC, C) DES, and D) LAN. X-axis denote experimental groups, Y-axis show sterol levels. Two-way ANOVA was performed using GraphPad Prism software. Rows represent variables (treatment, genotype), and the interaction of the two. Columns represent the main sterol species in the post-lanosterol biosynthesis pathway. Circles denote WT mice, squares denote Npy/Gad1 genotype. Filled symbols correspond to saline treatment, while red and blue colored symbols denote female and male animals, respectively. Groupwise comparisons are denoted by horizontal lines. Significance in groupwise comparisons: *p<0.05; **p<0.01; ***p<0.001.
In contrast, the multifactorial ANOVA analysis of the Pvalb/Gad1 experimental group (WT-saline [n=19]; WT-poly(I:C) [n=21]; Pvalb/Gad1-saline [n=16]; Pvalb/Gad1-poly[I:C] [n=15]) revealed that only poly(I:C) treatment altered the post-lanosterol biosynthesis profile. Follow-up inter-group magnitude comparisons revealed significantly reduced CHOL (16.5% and 14.7% change in WT-poly(I:C) and Pvalb/Gad1-poly(I:C), respectively), DES (14.1% and 15.5%), and LAN (20.5% change in both) (Figure 5). The genetic effect of Gad1 inhibition in PVALB-containing neurons did not result in significant disruption in sterol biosynthesis. In addition, no interaction was observed between any of the analyzed variables. The only statistically significant sex difference was observed for LAN in the Pvalb/Gad1 comparison, with female animal neocortices reporting higher LAN levels.
Figure 5. Sterol profile changes between saline-treated and maternal poly(I:C)-treated Pvalb/Gad1 transgenic and WT animal neocotrices at P90.
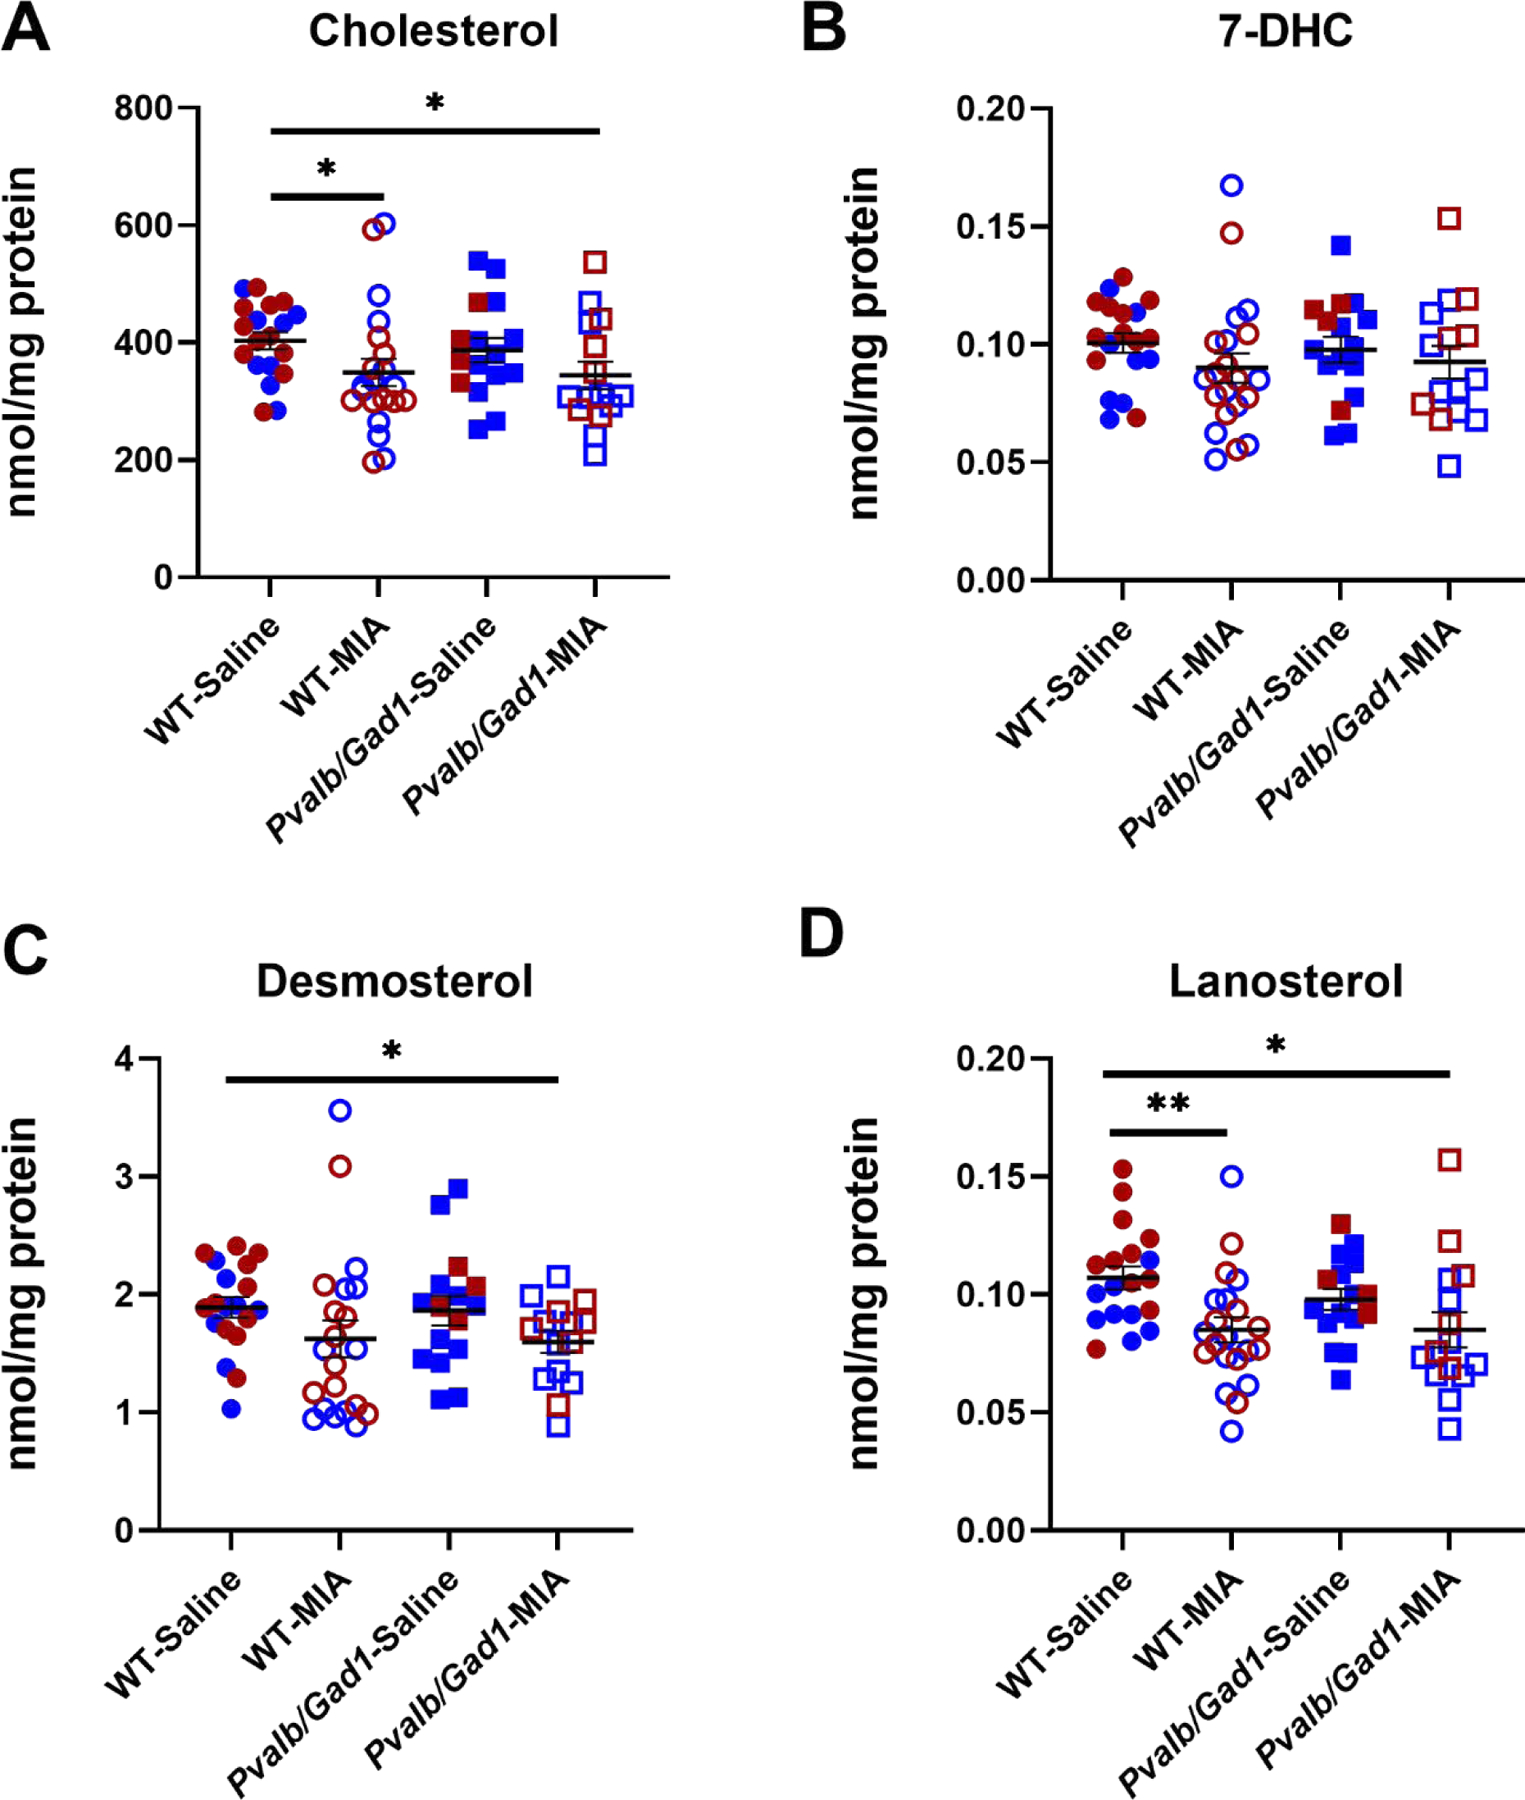
A) CHOL, B) 7-DHC, C) DES, and D) LAN. X-axis denote experimental groups, Y-axis show sterol levels. Two-way ANOVA was performed using GraphPad Prism software. Rows represent variables (treatment, genotype), and the interaction of the two. Columns represent the main sterol species in the post-lanosterol biosynthesis pathway. Circles denote WT mice, squares denote Pvalb/Gad1 genotype. Filled symbols correspond to saline treatment, while red and blue colored symbols denote female and male animals, respectively. Groupwise comparisons are denoted by horizontal lines. Significance in groupwise comparisons: *p<0.05; **p<0.01; ***p<0.001.
Maternal immune activation leads to long-term alterations in acylcarnitine levels in the offspring neocortices
Energy metabolism and mitochondrial disturbances are also an integral part of the pathophysiology in multiple brain disorders, including schizophrenia, bipolar disorder, and major depression (Clay et al., 2011; Holper et al., 2019; Konradi and Ongur, 2017; Middleton et al., 2002; Schwede et al., 2018). Acylcarnitines provide a readout of the proper functioning of this system, as the fatty acid (FA) catabolism constitutes a critical source of energy to the cells (Jones et al., 2010; Millington and Stevens, 2011; Viader et al., 2013). Short and long chain FAs are broken down to acetyl-CoA by a series of reactions known as β-oxidation (Schulz, 2013). The activated fatty acids (acyl-CoA) are conjugated with L-carnitine. Then, the generated acylcarnitines cross from the cytosol to the mitochondrial matrix via the carnitine shuttle (Longo et al., 2016).
To test our hypothesis that acylcarnitines are altered in MIA and/or genetic interneuron inhibition, half of each neocortex was assessed for acylcarnitines by LC-MS/MS. A multifactorial ANOVA analysis of the Npy/Gad1 experimental group (WT-saline [n=24]; WT-poly(I:C)[n=20]; Npy/Gad1-saline [n=27]; Npy/Gad1-poly[I:C] [n=11]) revealed acylcarnitines in the cortex were significantly changed by both the poly(I:C) treatment and genotype.
Follow-up intergroup comparisons revealed that saline-treated Npy/Gad1 animals had reduced total acylcarnitine levels by 14.7% (p<0.0001) in comparison to saline-treated WT animals (Figure 6A). Similarly, poly(I:C)-treated WT animal neocortices also showed reduced total acylcarnitine levels in comparison to the WT saline-treated animals (12.3%, p=0.0077), with significantly reduced levels of several individual acylcarnitine species (Supplemental Material 2).
Figure 6. Total acylcarnitine levels in the neocortex of saline-treated and maternal poly(I:C)-treated transgenic and WT animals at P90.
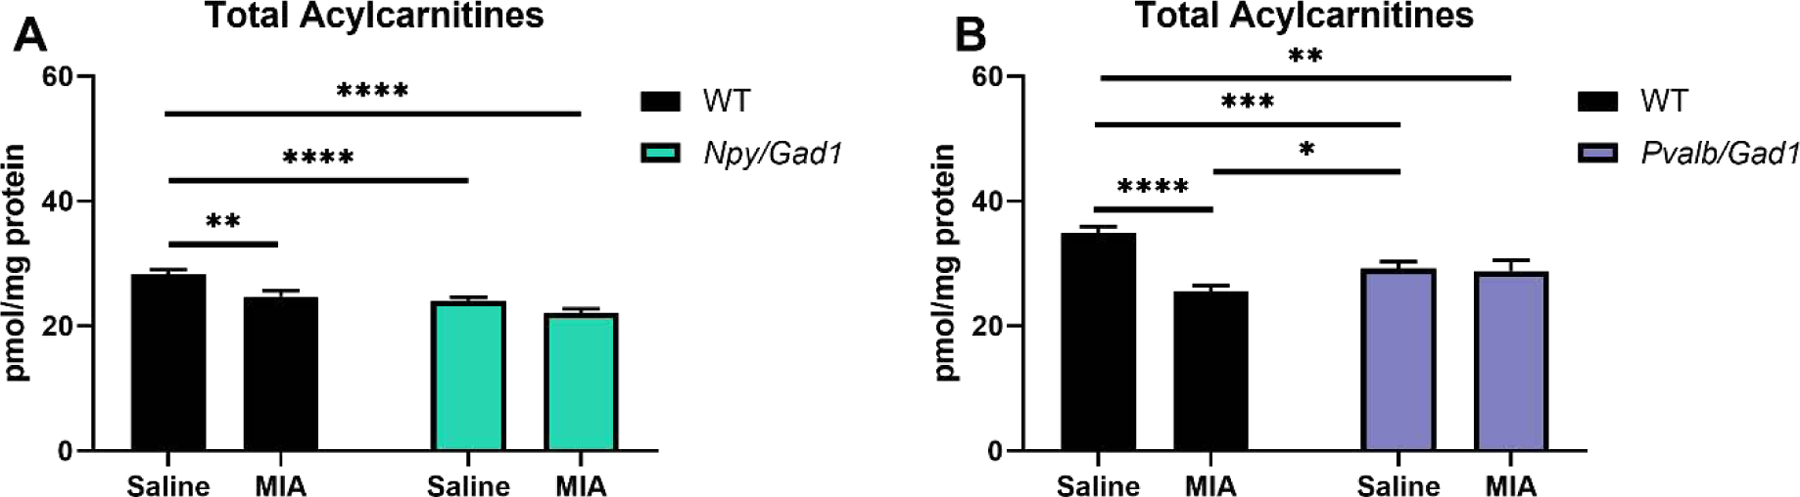
A) Npy/Gad1; B) Pvalb/Gad1. X-axis denotes experimental group, Y-axis shows sterol levels. In the two-way ANOVA analyses rows represent variables (treatment, genotype), and the interaction of the two. Groupwise comparisons are denoted by horizontal lines. Significance in groupwise comparisons: *p<0.05; **p<0.01; ***p<0.001; ****p<0.0001.
In contrast, in groupwise comparisons Pvalb/Gad1 saline-treated animals had a significant total acylcarnitine reduction in comparison to WT saline-treated animals (16.1%, p=0.0008). Poly(I:C)-treated WT also showed reduced acylcarnitine levels in comparison to the WT saline-treated animals (26.6%, p<0.0001) (Figure 6B). ANOVA analyses also suggested a significant genotype*MIA interaction.
DISCUSSION
The outcome of our experiments can be summarized as follows: 1) Maternal immune activation with poly(I:C) alone results in long-term consequences on the hippocampal neuroimmune gene expression, sterol profile, and acylcarnitine content. 2) Inhibition of Gad1 in NPY+ and PVALB+ interneurons is also characterized by altered neuroimmune transcripts, sterol profile, and acylcarnitine levels. 3) When mice carrying a genetic insult are exposed to maternal immune activation, the changes in neuroimmune transcripts, sterol profile, and acylcarnitine levels are mildly summative, but not strongly potentiating.
Neuroimmune gene expression findings
Maternal immune activation has a strong effect on brain development (Barke et al., 2019; Brown et al., 2014; Money et al., 2017; Murray et al., 2018; Smith et al., 2007). It results in anatomical, neurochemical, molecular, and behavioral changes in the exposed offspring (Garbett et al., 2012; Michel et al., 2012; Smith et al., 2007). MIA occurs as a result of various bacterial, viral or parasitic infections, and it is estimated that >30% of schizophrenia cases would be prevented if infection could be averted in pregnant women (Horvath and Mirnics, 2014). MIA on fetal brain does not require direct infection (Bauman and Van de Water, 2020; Garbett et al., 2012; Smith et al., 2007), as MIA occurs even in the absence of infective agents and can be mimicked by poly(I:C), LPS (Talukdar et al., 2020) or IL6 (Smith et al., 2007), suggesting that mother’s immune activation is critical for altering fetal brain development (Murray et al., 2018). MIA is an important risk factor for neurodevelopmental disorders, such as autism and schizophrenia (Horvath and Mirnics, 2014; Horvath and Mirnics, 2015; Michel et al., 2012). Previous studies found that adolescent MIA offspring showed elevated blood cytokine levels, microglial activation, increased pro-inflammatory cytokines expression, and increased oxidative stress in the cerebral cortex (Cieslik et al., 2020). Our findings further expand this literature, suggesting that the deficits persist beyond adolescence, and identify several transcript alterations that are putatively linked to altered neurodevelopment. Namely, in our experiments Brca1 transcript showed a greater than 30% decrease by MIA (p=0.019). In addition to the better known role of BRCA1 as a breast and ovarian cancer tumor suppressor (Takaoka and Miki, 2017), it is also a critical neurodevelopmental gene that is highly expressed in the brain (Expression, 2020). Deletion of Brca1 in the developing brain results in severe agenesis of multiple laminated cerebral structures, most notably affecting the neocortex, hippocampus, cerebellum, and olfactory bulbs (Pao et al., 2014). Importantly, this appears to be a result of excess apoptosis. Other transcript changes are also notable, as they suggest a link between the MIA driven neuroimmune gene expression changes and disturbances of sterol homeostasis. Altered expression of the Rgl1 transcript particularly attracted our attention, as it is involved in small GTPase mediated signal transduction and regulation of lipid metabolic processes (Shahnejat-Bushehri et al., 2016; Sood et al., 2000). In addition, the reduced expression of G protein-coupled receptor 183 (Gpr183) is also notable as it serves as a receptor for oxysterol 7α,25-dihydroxycholesterol (7-α, 25-OHC) and other related oxysterols (Huang et al., 2020).
Interneuron dysfunction, and particularly GAD67 reduction (encoded by the GAD1 gene) is a hallmark feature of schizophrenia (Brown et al., 2015; Volk and Lewis, 2002). Our transgenic mice mimic this feature, in a cell-type specific fashion (Garbett et al., 2010). The behavioral features of our Npy/Gad1 and Pvalb/Gad1 mice have been previously described (Brown et al., 2015; Schmidt et al., 2014), but the long-term biochemical and molecular features have been less understood to date. Npy/Gad1 saline treated animals, when compared to WT saline treated animals also showed multiple transcript changes of potential functional significance. Namely, the >50% upregulation of the Casp1 suggest a persistent, lasting insult to the brain. CASP1’s ability to proteolytically cleave and activate the inactive precursor of interleukin-1 also links it to MIA and multiple neuropsychiatric disorders (Kaushal et al., 2015). Pvalb/Gad1 saline treated animal brains, when compared to brains of WT saline treated animals, revealed a set of altered transcripts that both serve neuroimmune functions and neurodevelopment: Forkhead Box P3 (Foxp3), C-X-C Motif Chemokine Ligand 10 (Cxcl10), and Toll Like Receptor 2 (Tlr2). FOXP3, a transcription regulator, is the least studied member of the forkhead box family in the context of brain (Negi and Das, 2017). Brain mRNA expression and protein levels first peak during embryonic development, steadily decrease over time, and have a second peak during adulthood (Taylor et al., 2020). FOXP3 has the potential to dimerize with the other Foxp members and form heterodimers in the brain (Taylor et al., 2020), thus influencing neuronal development and function. CXCL10, a main ligand for CXCR3, is likely to be instrumental in neuron-microglia signaling (Vinet et al., 2009). Peripheral administration of the TLR2 ligand PAM3CSK4 (P3C) to neonatal mice induces the migration of innate immune cells, which in turn leads to dramatic neutrophil and monocyte infiltration to the CSF and periventricular brain (Mottahedin et al., 2019). All these transcript changes, combined with the other gene expression changes we found, have a potential to be at least partially responsible to the behavioral phenotypes of the Npy/Gad1 and Pvalb/Gad1 mice that we reported previously – especially if they occur over a lifetime.
The interaction between MIA and genetic interneuronal inhibition is complex and challenging to interpret without further experimental evidence. Clearly, the altered neuroimmune gene transcripts are quite different between the MIA-exposed Npy/Gad1 and Pvalb/Gad1 mice, with the highest number of altered mRNA levels observed in the Npy/Gad1 mice.
Changes in post-lanosterol sterol biosynthesis
Our investigation of post-lanosterol sterol precursors revealed that MIA treatment with poly(I:C), as well as Gad1 inactivation in NPY+ interneurons lead to significantly reduced levels of CHOL and DES. In contrast, inactivation of Gad1 in PVALB+ interneurons did not result in a significant reduction of these two sterols. We believe that this is potentially related to the behavioral deficits seen in MIA-exposed and Npy/Gad1 transgenic mice, as CHOL is an essential molecule for life, and is necessary for proper brain function. As the blood-brain-barrier prevents CHOL from entering the central nervous system from the systemic circulation, the brain fully relies on its own CHOL biosynthesis (Tint et al., 2006). Genetic disruptions of post-lanosterol biosynthesis give rise to complex developmental disorders, including Smith-Lemli-Opitz syndrome (SLOS) (mutations in DHCR7), desmosterolosis (mutations in DHCR24), chondrodysplasia punctata (mutations in EBP), lathosterolosis (mutations in SC5D), and CHILD syndrome (mutations in NSDHL) (Porter and Herman, 2010). All of these syndromes affect brain development, and lead to intellectual and developmental disabilities. In particular, 50–70% of SLOS patients meet the diagnostic features for autism spectrum disorders (Sikora et al., 2006; Tierney et al., 2000). Thus, we believe that a persistent reduction of CHOL and altered sterol biosynthesis in the brain over a lifetime will affect both brain development and adult brain function. Namely, it has been previously reported that brain CHOL levels decline with age, and higher brain CHOL levels are associated with better cognitive functions in humans (Elkana et al., 2018).
Acylcarnitine changes
Perhaps the most intriguing finding in our study is the observed long-term decrease in acylcarnitine levels in WT MIA and Npy/Gad1 transgenic mice. In humans, the acylcarnitine profile has been shown to be useful in identifying inborn errors of metabolism and different metabolic disruptions (Viader et al., 2013). While carnitine’s most widely known function is its involvement in ß-oxidation of fatty acids, acylcarnitine, and carnitine supplementation have resulted in beneficial effects in the treatment of various neurological diseases. It has been shown that acylcarnitines play an important role in neuroprotection (Jones et al., 2009). We interpret the reduction of total acylcarnitine levels in the MIA and Npy/Gad1 transgenic animals as result of altered brain energy state. However, the precise interpretation is perhaps more complex, as the alteration did not affect all acylcarnitine species equally. Namely, there were four acylcarnitine species significantly decreased in MIA, three saturated and one unsaturated species. The observed decrease in myristoyl (14:0), palmitoyl (16:0), stearoyl (18:0), and oleoyl (18:1) carnitine species could be due to an increase in cellular energy demand as a long-term effect of MIA (Jernberg et al., 2017; Jones et al., 2009; Viader et al., 2013; Yu et al., 2018). The cellular response to a higher energetic demand is to increase fatty acid catabolism (e.g. β-oxidation), which would result in lower levels of selected acylcarnitines. The mechanism behind these adaptations is unknown and warrants further experimental investigation.
Conclusions
In summary, we can conclude that both MIA and inactivation of interneuronal neurotransmission has long-term consequences that go beyond the primary genetic or environmental insult. These include but are likely not limited to persistent and complex neuroimmune transcriptome changes, disruptions of sterol biosynthesis, and biochemical changes related to energy metabolism. However, it remains to be elucidated how are these changes related to the ultimate readout, which are the behavioral changes seen in the investigated conditions.
METHODS AND MATERIALS
Ethical statement
All experimental procedures were approved by the University of Nebraska Medical Center’s Institutional Animal Care and Use Committee and the guidelines for proper animal use and care were strictly followed according to the Guide for the Care and Use of Laboratory animals of the National Institute of Health.
Chemicals
Unless otherwise noted, all chemicals were purchases through Sigma-Aldrich Co. (St. Louis, MO). Poly(I:C) was obtained from Sigma-Aldrich Co. (St. Louis, MO) and dissolved in 0.9% saline solution for the experiments. All sterol standards, natural and isotopically labeled, used in this study are available from Kerafast, Inc. (Boston, MA). HPLC grade solvents were purchased from Thermo Fisher Scientific Inc. (Waltham, MA).
Experimental animals
Transgenic mice were previously generated by the Vanderbilt Transgenic Mouse/Embryonic Stem Cell Shared Resource (http://www.vcscb.org/shared_resource/) on C57BL/6J background and described in detail previously. These mice have a reduced expression of glutamic acid decarboxylase 67kDa (GAD67 - encoded by the Gad1 gene) in the subpopulations of neuropeptide Y (NPY) and parvalbumin (PVALB) expressing interneurons (Garbett et al., 2010). Mice were housed in microisolator cages at the UNMC animal housing facility. Water and food (Teklad LM-485 Mouse/Rat autoclaved Diet 7012) were provided ad libitum during the 12-h light/dark cycle. Enrichment was provided in every cage in the form of crinkle paper and social housing. Mice used in the experiments were housed in the colony breeding room until the experimental age was reached at P90.
Maternal immune activation
Adult male Pvalb/Gad1 and Npy/Gad1 were bred with female wild type (WT) mice between four to six months of age. Females all had at least two prior pregnancies to maximize litter size. Maternal weight gain was used to determine timed pregnancy. Females were given a single intraperitoneal injection of saline or polyinosinic–polycytidilic acid ([poly(I:C)] at E12.5, producing a systemic maternal inflammation. The timing of poly(I:C) exposure (E12.5) was selected based on previously described models producing long-lasting structural brain alterations and behavioral deficits in the affected offspring (Garbett et al., 2012; Money et al., 2018; Shi et al., 2003; Smith et al., 2007). On the day of the injections, poly(I:C) (Sigma Aldrich, St Louis, MO, USA) was dissolved in saline. The injected poly(I:C) amount was calculated based on the weight of each individual dam. Saline was injected as a control, based on 100µL/10g body weight for each control dam.
The resulting offspring was group housed until age of P90 and were killed by cervical dislocation. Brains were rapidly dissected on ice, and brain regions were harvested by anatomical landmarks using free-hand dissection.
This generated six groups of brain samples: 1) WT saline treated; 2) WT poly(I:C)-treated; 3) Npy/Gad1 saline treated; 4) Npy/Gad1 poly(I:C)-treated; 5) Pvalb/Gad1 saline treated; 6) Pvalb/Gad1 poly(I:C)-treated. Due to limitation of biological material, hippocampal samples were used for gene expression studies, while neocortical samples were used for biochemical assessments.
RNA isolation and Nanostring® transcriptional profiling
For gene expression profiling experiments we used a total of 48 individual hippocampal samples, divided in the following way across the experimental groups: 1) WT saline treated (n=12; 7 males + 5 females); 2) WT poly(I:C)-treated (n=12; 6 males + 6 females); 3) Npy/Gad1 saline treated (n=6; 3 males + 3 females); 4) Npy/Gad1 poly(I:C)-treated (n=6; 3 males + 3 females); 5) Pvalb/Gad1 saline treated (n=6; 3 males + 3 females); 6) Pvalb/Gad1 poly(I:C)-treated (n=6; 3 males + 3 females).
Hippocampal RNA isolation was performed using a Mini Qiagen RNA extraction kit. All samples underwent a Qiagen RNeasy clean-up, following manufacturer’s instructions. A Thermo Scientific Nanodrop 2000 (Thermo Scientific, Waltham, MA, USA) was utilized to measure RNA concentration and purity at absorbance 260/280 values and 260/230. An Agilent 2100 Bioanalyzer (Agilent Technologies, Santa Clara, CA, USA) was used to ensure RNA integrity (RIN>8). RNA from individual hippocampi was used to establish gene expression levels of genes involved in inflammation on a Nanostring platform. The utilized mouse inflammation panel included 757 inflammation-related mouse genes and fifteen normalizers (Nanostring, 2020). Normalized count data was obtained by the n-Counter Digital Analyzer.
Biochemical analyses
For biochemical assessments, we used a total of 153 individual neocortical samples, divided in the following way across the experimental groups: 1) WT saline treated (n=43; 18 males + 25 females); 2) WT poly(I:C)-treated (n= 41; 21 males + 2 females); 3) Npy/Gad1 saline treated (n=27; 19 males + 8 females); 4) Npy/Gad1 poly(I:C)-treated (n=11; 4 males + 7 females); 5) Pvalb/Gad1 saline treated (n=16; 12 males + 4 females); 6) Pvalb/Gad1 poly(I:C)-treated (n=15; 9 males + 6 females).
Sterol profile analyses.
Sterols were extracted and derivatized with PTAD as described previously (Liu et al., 2014) and placed in an Acquity UPLC system equipped with ANSI- compliant well plate holder coupled to a Thermo Scientific TSQ Quantis mass spectrometer equipped with an APCI source. 5 µL was injected onto the column (Phenomenex Luna Omega C18, 1.6 µm, 100 Å, 2.1 mm × 50 mm) with 100% MeOH (0.1% v/v acetic acid) mobile phase for 1.0 min runtime at a flow rate of 500 µL/min. Natural sterols were analyzed by selective reaction monitoring using the following transitions: CHOL 369 → 369, 7-DHC 560 → 365, DES 592 → 560, LAN 634 → 602, with retention times of 0.7, 0.4, 0.3 and 0.3 min, respectively. SRMs for the internal standards were set to: d7-CHOL 376 → 376, d7-7-DHC 567 → 372, 13C3-DES 595 → 563, 13C3-LAN 637 → 605. Final sterol numbers are reported as nmol/mg of protein. Notably, 8-dehydrocholesterol (8-DHC) and 7-dehydrodesmosterol (7-DHD) also react with PTAD giving adducts that have similar chromatographic and MS fragmentation characteristics. As a result, due to our inability to resolve 8-DHC and 7-DHD contribution to the sterol profile, we did not include these data in the manuscript.
Acylcarnitine profile analyses.
The acylcarnitine profile was assessed by LC-MS/MS as described previously (Brittain et al., 2016). Briefly, we added to the samples a known amount of d3-palmitoylcarnitine as the internal standard. After extraction, the lysates were injected onto the column (Phenomenex Luna Omega C18, 1.6 µm, 100 Å, 2.1 mm × 100 mm) using acetonitrile/water (90:10 v/v, 0.1% v/v formic acid and 10 mM ammonium formate) (solvent B) and acetonitrile/water (10:90 v/v, 0.1% v/v formic acid and 10 mM ammonium formate) (solvent A) as mobile phases. The total run time was 5.5 min at a flow rate of 500 µL/min. The LC gradient was set to: 40% B for 0.5 min; 40% to 90% B for 1.5 min; 90% B for 2 min; 90% to 100% B for 0.1 min; 100% B for 0.8 min; 100% to 40% B for 0.1 min; 40% B for 0.7 min. Individual acylcarnitines were analyzed by an Acquity UPLC system equipped with ANSI compliant well plate holder coupled to a Thermo Scientific TSQ Quantis mass spectrometer equipped with an APCI source. Analyses were done in the positive ion mode and individual acylcarnitine species were measured by selective reaction monitoring (SRM) using transitions of the precursor ion (as [M+H]+) to the respective product ions with 85 m/z.
Statistical analyses
Assessment of significance was performed separately for the Pvalb/Gad1 and Npy/Gad1 mice in comparison to saline-treated and MIA-treated controls. Both ANOVA and inter-group groupwise t-test analyses were performed for the biochemical experiments. For the gene expression profiling experiments normalized counts were exported to Excel and Prism GraphPad for ANOVA analyses and visualization. Unsupervised, two-way hierarchical clustering based on average linkage was performed by Morpheus on normalized log2 values.
Supplementary Material
Row 1 denotes the seven comparisons indicated in Figure 1. Columns denote gene symbols, average log2 ratio (ALR), and significance of expression change (pval). Genes were considered differentially expressed based on a dual criteria of average log2 ratio (ALR) of >0.263 or <−0.263 and p<0.05.
Acylcarnitine species are denoted on the X-axis, Y-axis denotes tissue concertation. Note that relative concentration of acylcarnitine species in the brain is highly variable, and MIA have differential effect on the various species. Groupwise comparisons are denoted by horizontal lines. Significance in groupwise comparisons: *p<0.05; **p<0.01; ***p<0.001; ****p<0.0001.
MIA and inhibition of interneuronal function have long-term consequences
Disruptions include inflammatory gene expression and sterol biosynthesis changes
Both MIA and genetic inhibition of Gad1 alter the typical acylcarnitine profile
Gad1 inhibition in NPY+ and PVALB+ neurons have differential consequences
Acknowledgements
This work was supported by the National Institutes of Health grant NIMH MH06724. We thank Comparative Medicine at the University of Nebraska Medical Center (UNMC) for their expert care for the experimental animals.
The University of Nebraska Medical Center (UNMC) Genomics Core receives partial support from the National Institute for General Medical Science (NIGMS) INBRE - P20GM103427–19 grant as well as The Fred & Pamela Buffett Cancer Center Support Grant - P30 CA036727. This publication’s contents are the sole responsibility of the authors and do not necessarily represent the official views of the NIH or NIGMS. We are also thankful to the Laboratory for Molecular Biology and Cytometry Research at OUHSC for the use of the Core Facility which provided NanoString Sprint assay data and analysis support.
Footnotes
Publisher's Disclaimer: This is a PDF file of an unedited manuscript that has been accepted for publication. As a service to our customers we are providing this early version of the manuscript. The manuscript will undergo copyediting, typesetting, and review of the resulting proof before it is published in its final form. Please note that during the production process errors may be discovered which could affect the content, and all legal disclaimers that apply to the journal pertain.
Conflict of Interest
The authors declare no conflict of interest that is in any form related to the presented material, experiments, or outcomes.
REFERENCES:
- Alexopoulou L, et al. , 2001. Recognition of double-stranded RNA and activation of NF-kappaB by Toll-like receptor 3. Nature 413, 732–8. [DOI] [PubMed] [Google Scholar]
- Barke TL, et al. , 2019. Sex modifies placental gene expression in response to metabolic and inflammatory stress. Placenta 78, 1–9. [DOI] [PMC free article] [PubMed] [Google Scholar]
- Bauman MD, Van de Water J, 2020. Translational opportunities in the prenatal immune environment: Promises and limitations of the maternal immune activation model. Neurobiol Dis 141, 104864. [DOI] [PMC free article] [PubMed] [Google Scholar]
- Benes FM, Berretta S, 2001. GABAergic interneurons: implications for understanding schizophrenia and bipolar disorder. Neuropsychopharmacology 25, 1–27. [DOI] [PubMed] [Google Scholar]
- Brittain EL, et al. , 2016. Fatty Acid Metabolic Defects and Right Ventricular Lipotoxicity in Human Pulmonary Arterial Hypertension. Circulation 133, 1936–44. [DOI] [PMC free article] [PubMed] [Google Scholar]
- Brown JA, et al. , 2014. Metabolic consequences of interleukin-6 challenge in developing neurons and astroglia. J Neuroinflammation 11, 183. [DOI] [PMC free article] [PubMed] [Google Scholar]
- Brown JA, et al. , 2015. Inhibition of parvalbumin-expressing interneurons results in complex behavioral changes. Mol Psychiatry 20, 1499–507. [DOI] [PMC free article] [PubMed] [Google Scholar]
- Bryson A, et al. , 2020. GABA-mediated tonic inhibition differentially modulates gain in functional subtypes of cortical interneurons. Proc Natl Acad Sci U S A. 117, 3192–3202. [DOI] [PMC free article] [PubMed] [Google Scholar]
- Bu DF, Tobin AJ, 1994. The exon-intron organization of the genes (GAD1 and GAD2) encoding two human glutamate decarboxylases (GAD67 and GAD65) suggests that they derive from a common ancestral GAD. Genomics 21, 222–8. [DOI] [PubMed] [Google Scholar]
- Canetta S, et al. , 2016. Maternal immune activation leads to selective functional deficits in offspring parvalbumin interneurons. Mol Psychiatry 21, 956–68. [DOI] [PMC free article] [PubMed] [Google Scholar]
- Cao B, et al. , 2019. Characterizing acyl-carnitine biosignatures for schizophrenia: a longitudinal pre- and post-treatment study. Transl Psychiatry 9, 19. [DOI] [PMC free article] [PubMed] [Google Scholar]
- Cieslik M, et al. , 2020. Maternal Immune Activation Induces Neuroinflammation and Cortical Synaptic Deficits in the Adolescent Rat Offspring. Int J Mol Sci 21. [DOI] [PMC free article] [PubMed] [Google Scholar]
- Clay HB, Sillivan S, Konradi C, 2011. Mitochondrial dysfunction and pathology in bipolar disorder and schizophrenia. Int J Dev Neurosci 29, 311–24. [DOI] [PMC free article] [PubMed] [Google Scholar]
- Corder KM, et al. , 2018. Prefrontal cortex-dependent innate behaviors are altered by selective knockdown of Gad1 in neuropeptide Y interneurons. PLoS One 13, e0200809. [DOI] [PMC free article] [PubMed] [Google Scholar]
- DeFelipe J, et al. , 2013. New insights into the classification and nomenclature of cortical GABAergic interneurons. Nat Rev Neurosci 14, 202–16. [DOI] [PMC free article] [PubMed] [Google Scholar]
- Dienel SJ, Lewis DA, 2018. Alterations in cortical interneurons and cognitive function in schizophrenia. Neurobiol Dis 131, 104208. [DOI] [PMC free article] [PubMed] [Google Scholar]
- Elkana O, et al. , 2018. The association of total cholesterol with processing speed is moderated by age in mid- to late-age healthy adults. Exp Aging Res 44, 179–186. [DOI] [PubMed] [Google Scholar]
- Expression, 2020. https://www.proteinatlas.org/ENSG00000012048-BRCA1/tissue. Vol., ed.êds.
- Fishell G, Kepecs A, 2019. Interneuron Types as Attractors and Controllers. Annu Rev Neurosci 43, 1–30. [DOI] [PMC free article] [PubMed] [Google Scholar]
- Garbett KA, et al. , 2010. Novel animal models for studying complex brain disorders: BAC-driven miRNA-mediated in vivo silencing of gene expression. Mol Psychiatry 15, 987–95. [DOI] [PMC free article] [PubMed] [Google Scholar]
- Garbett KA, et al. , 2012. Effects of maternal immune activation on gene expression patterns in the fetal brain. Transl Psychiatry 2, e98. [DOI] [PMC free article] [PubMed] [Google Scholar]
- Gonzalez-Burgos G, Lewis DA, 2012. NMDA receptor hypofunction, parvalbumin-positive neurons, and cortical gamma oscillations in schizophrenia. Schizophr Bull 38, 950–7. [DOI] [PMC free article] [PubMed] [Google Scholar]
- Gonzalez-Burgos G, Cho RY, Lewis DA, 2015. Alterations in cortical network oscillations and parvalbumin neurons in schizophrenia. Biol Psychiatry 77, 1031–40. [DOI] [PMC free article] [PubMed] [Google Scholar]
- Hashemi E, et al. , 2016. The Number of Parvalbumin-Expressing Interneurons Is Decreased in the Prefrontal Cortex in Autism. Cereb Cortex 27, 1931–1943. [DOI] [PMC free article] [PubMed] [Google Scholar]
- Herman GE, 2003. Disorders of cholesterol biosynthesis: prototypic metabolic malformation syndromes. Hum Mol Genet 12 Spec No 1, R75–88. [DOI] [PubMed]
- Holper L, Ben-Shachar D, Mann JJ, 2019. Multivariate meta-analyses of mitochondrial complex I and IV in major depressive disorder, bipolar disorder, schizophrenia, Alzheimer disease, and Parkinson disease. Neuropsychopharmacology 44, 837–849. [DOI] [PMC free article] [PubMed] [Google Scholar]
- Horvath S, Mirnics K, 2014. Immune system disturbances in schizophrenia. Biol Psychiatry 75, 316–23. [DOI] [PMC free article] [PubMed] [Google Scholar]
- Horvath S, Mirnics K, 2015. Schizophrenia as a disorder of molecular pathways. Biol Psychiatry 77, 22–8. [DOI] [PMC free article] [PubMed] [Google Scholar]
- Hu H, Gan J, Jonas P, 2014. Interneurons. Fast-spiking, parvalbumin(+) GABAergic interneurons: from cellular design to microcircuit function. Science 345, 1255263. [DOI] [PubMed] [Google Scholar]
- Huang J, et al. , 2020. 7alpha,25-Dihydroxycholesterol Suppresses Hepatocellular Steatosis through GPR183/EBI2 in Mouse and Human Hepatocytes. J Pharmacol Exp Ther 374, 142–150. [DOI] [PubMed] [Google Scholar]
- Jernberg JN, et al. , 2017. Developmental regulation and localization of carnitine palmitoyltransferases (CPTs) in rat brain. J Neurochem 142, 407–419. [DOI] [PMC free article] [PubMed] [Google Scholar]
- Jones LL, McDonald DA, Borum PR, 2009. Acylcarnitines: role in brain. Prog Lipid Res 49, 61–75. [DOI] [PubMed] [Google Scholar]
- Jones LL, McDonald DA, Borum PR, 2010. Acylcarnitines: role in brain. Prog Lipid Res 49, 61–75. [DOI] [PubMed] [Google Scholar]
- Kalman S, et al. , 2014. Metabolic stress-induced microRNA and mRNA expression profiles of human fibroblasts. Exp Cell Res 320, 343–53. [DOI] [PMC free article] [PubMed] [Google Scholar]
- Karagiannis A, et al. , 2009. Classification of NPY-expressing neocortical interneurons. J Neurosci 29, 3642–59. [DOI] [PMC free article] [PubMed] [Google Scholar]
- Kaushal V, et al. , 2015. Neuronal NLRP1 inflammasome activation of Caspase-1 coordinately regulates inflammatory interleukin-1-beta production and axonal degeneration-associated Caspase-6 activation. Cell Death Differ 22, 1676–86. [DOI] [PMC free article] [PubMed] [Google Scholar]
- Kavoor AR, et al. , 2017. Lipids, aggression, suicidality and impulsivity in drug-naive/drug-free patients of schizophrenia. Asian J Psychiatr 27, 129–136. [DOI] [PubMed] [Google Scholar]
- Kim Y, et al. , 2017. Molecular Mechanisms of Bipolar Disorder: Progress Made and Future Challenges. Front Cell Neurosci 11, 30. [DOI] [PMC free article] [PubMed] [Google Scholar]
- Konradi C, Ongur D, 2017. Role of mitochondria and energy metabolism in schizophrenia and psychotic disorders. Schizophr Res 187, 1–2. [DOI] [PubMed] [Google Scholar]
- Korade Z, Kenworthy AK, Mirnics K, 2009. Molecular consequences of altered neuronal cholesterol biosynthesis. J Neurosci Res 87, 866–75. [DOI] [PMC free article] [PubMed] [Google Scholar]
- Lewis DA, et al. , 2011. Cortical parvalbumin interneurons and cognitive dysfunction in schizophrenia. Trends Neurosci 35, 57–67. [DOI] [PMC free article] [PubMed] [Google Scholar]
- Liberman AC, et al. , 2018. Neuroimmune and Inflammatory Signals in Complex Disorders of the Central Nervous System. Neuroimmunomodulation 25, 246–270. [DOI] [PubMed] [Google Scholar]
- Lim L, et al. , 2018. Development and Functional Diversification of Cortical Interneurons. Neuron 100, 294–313. [DOI] [PMC free article] [PubMed] [Google Scholar]
- Liu W, et al. , 2014. A highly sensitive method for analysis of 7-dehydrocholesterol for the study of Smith-Lemli-Opitz syndrome. J Lipid Res 55, 329–37. [DOI] [PMC free article] [PubMed] [Google Scholar]
- Longo N, Frigeni M, Pasquali M, 2016. Carnitine transport and fatty acid oxidation. Biochim Biophys Acta 1863, 2422–35. [DOI] [PMC free article] [PubMed] [Google Scholar]
- Melo HM, Santos LE, Ferreira ST, 2019. Diet-Derived Fatty Acids, Brain Inflammation, and Mental Health. Front Neurosci 13, 265. [DOI] [PMC free article] [PubMed] [Google Scholar]
- Meyer U, et al. , 2008. Adult brain and behavioral pathological markers of prenatal immune challenge during early/middle and late fetal development in mice. Brain Behav Immun 22, 469–86. [DOI] [PubMed] [Google Scholar]
- Meyer U, 2019. Neurodevelopmental Resilience and Susceptibility to Maternal Immune Activation. Trends Neurosci 42, 793–806. [DOI] [PubMed] [Google Scholar]
- Michel M, Schmidt MJ, Mirnics K, 2012. Immune system gene dysregulation in autism and schizophrenia. Dev Neurobiol 72, 1277–87. [DOI] [PMC free article] [PubMed] [Google Scholar]
- Middleton FA, et al. , 2002. Gene expression profiling reveals alterations of specific metabolic pathways in schizophrenia. J Neurosci 22, 2718–29. [DOI] [PMC free article] [PubMed] [Google Scholar]
- Millington DS, Stevens RD, 2011. Acylcarnitines: analysis in plasma and whole blood using tandem mass spectrometry. Methods Mol Biol 708, 55–72. [DOI] [PubMed] [Google Scholar]
- Mirnics K, et al. , 2000. Molecular characterization of schizophrenia viewed by microarray analysis of gene expression in prefrontal cortex. Neuron 28, 53–67. [DOI] [PubMed] [Google Scholar]
- Money KM, et al. , 2017. Gestational diabetes exacerbates maternal immune activation effects in the developing brain. Mol Psychiatry 23, 1920–1928. [DOI] [PMC free article] [PubMed] [Google Scholar]
- Money KM, et al. , 2018. Gestational diabetes exacerbates maternal immune activation effects in the developing brain. Mol Psychiatry 23, 1920–1928. [DOI] [PMC free article] [PubMed] [Google Scholar]
- Mottahedin A, et al. , 2019. Choroid plexus transcriptome and ultrastructure analysis reveals a TLR2-specific chemotaxis signature and cytoskeleton remodeling in leukocyte trafficking. Brain Behav Immun 79, 216–227. [DOI] [PMC free article] [PubMed] [Google Scholar]
- Mueller FS, et al. , 2020. Behavioral, neuroanatomical, and molecular correlates of resilience and susceptibility to maternal immune activation. Mol Psychiatry [DOI] [PMC free article] [PubMed]
- Murray KN, et al. , 2018. Evolution of a maternal immune activation (mIA) model in rats: Early developmental effects. Brain Behav Immun 75, 48–59. [DOI] [PubMed] [Google Scholar]
- Nanostring, 2020. https://www.nanostring.com/products/gene-expression-panels/gene-expression-panels-overview/hallmarks-cancer-gene-expression-panel-collection/pancancer-immune-profiling-panel Vol., ed.êds.
- Negi N, Das BK, 2017. CNS: Not an immunoprivilaged site anymore but a virtual secondary lymphoid organ. Int Rev Immunol 37, 57–68. [DOI] [PubMed] [Google Scholar]
- Pao GM, et al. , 2014. Role of BRCA1 in brain development. Proc Natl Acad Sci U S A 111, E1240–8. [DOI] [PMC free article] [PubMed] [Google Scholar]
- Petilla Interneuron Nomenclature, G., et al. , 2008. Petilla terminology: nomenclature of features of GABAergic interneurons of the cerebral cortex. Nat Rev Neurosci 9, 557–68. [DOI] [PMC free article] [PubMed] [Google Scholar]
- Porter FD, 2008. Smith-Lemli-Opitz syndrome: pathogenesis, diagnosis and management. Eur J Hum Genet 16, 535–41. [DOI] [PubMed] [Google Scholar]
- Porter FD, Herman GE, 2010. Malformation syndromes caused by disorders of cholesterol synthesis. J Lipid Res 52, 6–34. [DOI] [PMC free article] [PubMed] [Google Scholar]
- Porter FD, Herman GE, 2011. Malformation syndromes caused by disorders of cholesterol synthesis. J Lipid Res 52, 6–34. [DOI] [PMC free article] [PubMed] [Google Scholar]
- Schmidt MJ, Mirnics K, 2012. Modeling interneuron dysfunction in schizophrenia. Dev Neurosci 34, 152–8. [DOI] [PubMed] [Google Scholar]
- Schmidt MJ, et al. , 2013. Modulation of behavioral networks by selective interneuronal inactivation. Mol Psychiatry 19, 580–7. [DOI] [PMC free article] [PubMed] [Google Scholar]
- Schmidt MJ, et al. , 2014. Modulation of behavioral networks by selective interneuronal inactivation. Mol Psychiatry 19, 580–7. [DOI] [PMC free article] [PubMed] [Google Scholar]
- Schulz H, 2013. Fatty acid oxidation. In: Encyclopedia of Biological Chemistry (second edition). Vol., Lennarz WJ, Lane Daniel, ed.êds. Academic Press, pp. 281–284. [Google Scholar]
- Schwede M, et al. , 2018. Strong correlation of downregulated genes related to synaptic transmission and mitochondria in post-mortem autism cerebral cortex. J Neurodev Disord 10, 18. [DOI] [PMC free article] [PubMed] [Google Scholar]
- Shahnejat-Bushehri S, et al. , 2016. Arabidopsis NAC transcription factor JUB1 regulates GA/BR metabolism and signalling. Nat Plants 2, 16013. [DOI] [PubMed] [Google Scholar]
- Shi L, et al. , 2003. Maternal influenza infection causes marked behavioral and pharmacological changes in the offspring. J Neurosci 23, 297–302. [DOI] [PMC free article] [PubMed] [Google Scholar]
- Sikora DM, et al. , 2006. The near universal presence of autism spectrum disorders in children with Smith-Lemli-Opitz syndrome. Am J Med Genet A 140, 1511–8. [DOI] [PubMed] [Google Scholar]
- Smith SE, et al. , 2007. Maternal immune activation alters fetal brain development through interleukin-6. J Neurosci 27, 10695–702. [DOI] [PMC free article] [PubMed] [Google Scholar]
- Sood R, et al. , 2000. The human RGL (RalGDS-like) gene: cloning, expression analysis and genomic organization. Biochim Biophys Acta 1491, 285–8. [DOI] [PubMed] [Google Scholar]
- Swanson OK, Maffei A, 2019. From Hiring to Firing: Activation of Inhibitory Neurons and Their Recruitment in Behavior. Front Mol Neurosci 12, 168. [DOI] [PMC free article] [PubMed] [Google Scholar]
- Takaoka M, Miki Y, 2017. BRCA1 gene: function and deficiency. Int J Clin Oncol 23, 36–44. [DOI] [PubMed] [Google Scholar]
- Talukdar PM, et al. , 2020. Maternal Immune Activation Causes Schizophrenia-like Behaviors in the Offspring through Activation of Immune-Inflammatory, Oxidative and Apoptotic Pathways, and Lowered Antioxidant Defenses and Neuroprotection. Mol Neurobiol 57, 4345–4361. [DOI] [PubMed] [Google Scholar]
- Taylor MR, et al. , 2020. Age, but Not Sex, Modulates Foxp3 Expression in the Rat Brain across Development. Neuroscience 442, 87–99. [DOI] [PubMed] [Google Scholar]
- Tierney E, Nwokoro NA, Kelley RI, 2000. Behavioral phenotype of RSH/Smith-Lemli-Opitz syndrome. Ment Retard Dev Disabil Res Rev 6, 131–4. [DOI] [PubMed] [Google Scholar]
- Tint GS, et al. , 2006. The use of the Dhcr7 knockout mouse to accurately determine the origin of fetal sterols. J Lipid Res 47, 1535–41. [DOI] [PMC free article] [PubMed] [Google Scholar]
- Tomson-Johanson K, Harro J, 2018. Low cholesterol, impulsivity and violence revisited. Curr Opin Endocrinol Diabetes Obes 25, 103–107. [DOI] [PubMed] [Google Scholar]
- Tremblay R, Lee S, Rudy B, 2016. GABAergic Interneurons in the Neocortex: From Cellular Properties to Circuits. Neuron 91, 260–92. [DOI] [PMC free article] [PubMed] [Google Scholar]
- Vasistha NA, et al. , 2019. Maternal inflammation has a profound effect on cortical interneuron development in a stage and subtype-specific manner. Mol Psychiatry 25, 2313–2329. [DOI] [PMC free article] [PubMed] [Google Scholar]
- Viader A, et al. , 2013. Aberrant Schwann cell lipid metabolism linked to mitochondrial deficits leads to axon degeneration and neuropathy. Neuron 77, 886–98. [DOI] [PMC free article] [PubMed] [Google Scholar]
- Vinet J, et al. , 2009. Expression of CXCL10 in cultured cortical neurons. J Neurochem 112, 703–14. [DOI] [PubMed] [Google Scholar]
- Volk DW, Lewis DA, 2002. Impaired prefrontal inhibition in schizophrenia: relevance for cognitive dysfunction. Physiol Behav 77, 501–5. [DOI] [PubMed] [Google Scholar]
- Wassif CA, et al. , 2007. HEM dysplasia and ichthyosis are likely laminopathies and not due to 3beta-hydroxysterol Delta14-reductase deficiency. Hum Mol Genet 16, 1176–87. [DOI] [PubMed] [Google Scholar]
- Yu D, et al. , 2018. Strategy for Comprehensive Identification of Acylcarnitines Based on Liquid Chromatography-High-Resolution Mass Spectrometry. Anal Chem 90, 5712–5718. [DOI] [PubMed] [Google Scholar]
- Zuccoli GS, et al. , 2017. The Energy Metabolism Dysfunction in Psychiatric Disorders Postmortem Brains: Focus on Proteomic Evidence. Front Neurosci 11, 493. [DOI] [PMC free article] [PubMed] [Google Scholar]
Associated Data
This section collects any data citations, data availability statements, or supplementary materials included in this article.
Supplementary Materials
Row 1 denotes the seven comparisons indicated in Figure 1. Columns denote gene symbols, average log2 ratio (ALR), and significance of expression change (pval). Genes were considered differentially expressed based on a dual criteria of average log2 ratio (ALR) of >0.263 or <−0.263 and p<0.05.
Acylcarnitine species are denoted on the X-axis, Y-axis denotes tissue concertation. Note that relative concentration of acylcarnitine species in the brain is highly variable, and MIA have differential effect on the various species. Groupwise comparisons are denoted by horizontal lines. Significance in groupwise comparisons: *p<0.05; **p<0.01; ***p<0.001; ****p<0.0001.