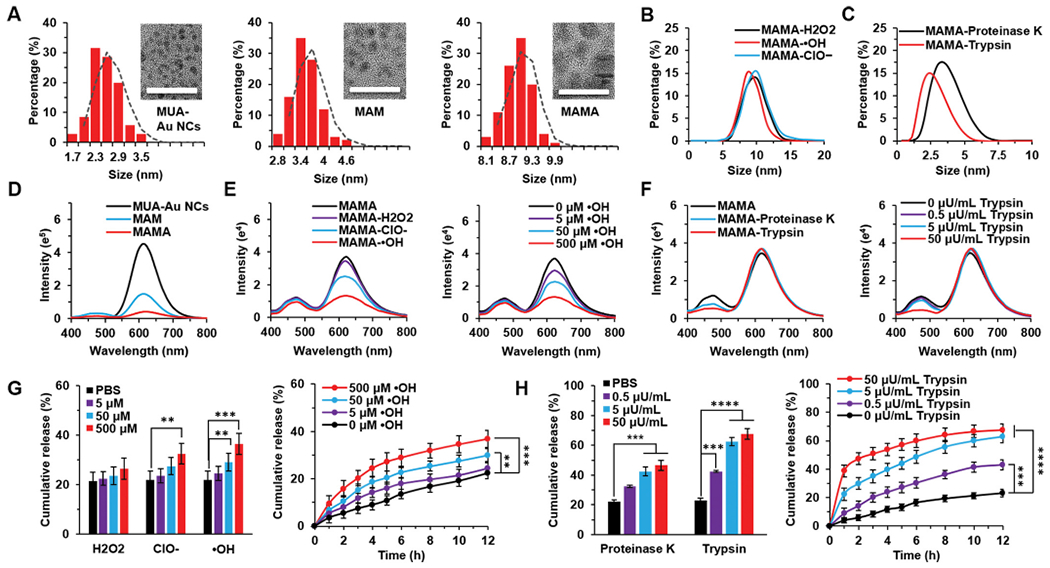
Fig. 1.

Size, fluorescent intensity and drug release of MAMA under ROS and enzyme incubation. (A) Size characterization and transmission electron microscopy (TEM) images of MUA-Au NCs, MAM, and MAMA. Scale bar = 20 nm. (B) The dynamic light scattering (DLS)-measured size distribution of MAMA incubated with ROS. (C) The DLS-measured size distribution of MAMA incubated with enzymes. (D) Fluorescence spectra of MAMA. (E) Fluorescence spectra of MAMA incubated with H2O2, ClO−, and •OH, respectively. (F) Fluorescence spectra of MAMA incubated with proteinase K and trypsin. (G) The drug release of MAMA incubated with H2O2, ClO−, and •OH, respectively. (H) The drug release of MAMA incubated with proteinase K and trypsin. All result represents the mean ± standard deviation (SD) (**P < .01, ***P < .001, and ****P < .0001).
