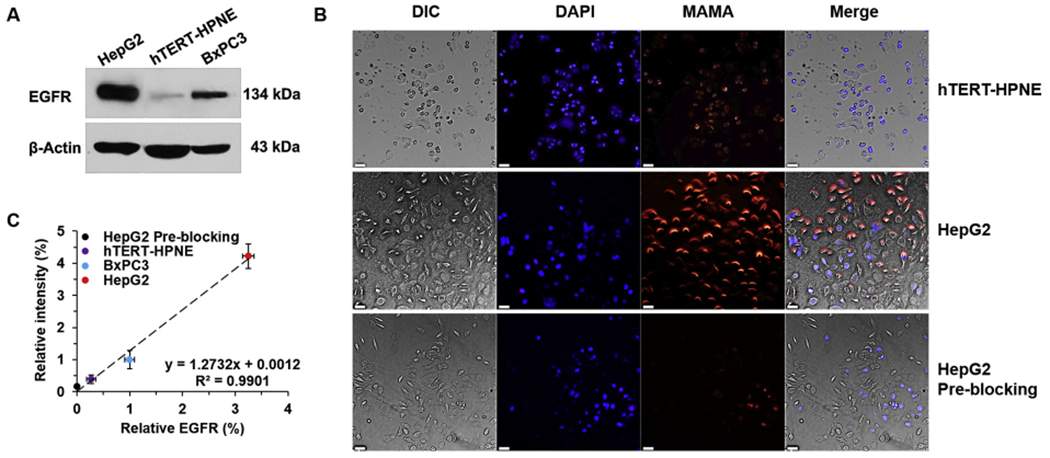
Fig. 2.

EGFR targeting and imaging properties of MAMA in cells. (A) EGFR western-blot analysis of cells. (B) Confocal images of cells incubated with MAMA for 30 min. Bars = 50 μm. (C) The quantitative relationship between relative EGFR protein level and relative intensity of MAMA in cells. All result represents the mean ± standard deviation (SD).
