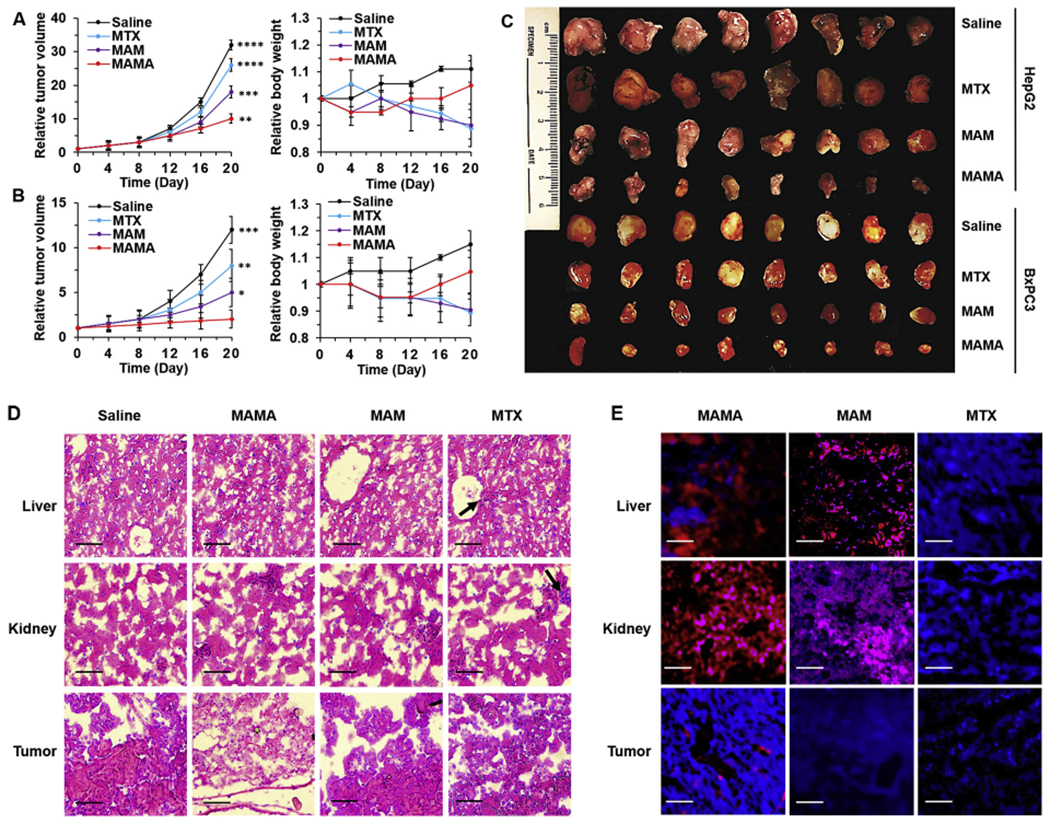
Fig. 5.

In vivo cancer inhibition and side effects evaluation. Relative tumor volume and body weight changes of (A) HepG2 and (B) BxPC3 tumor-bearing mice under different treatment for three weeks. (C) Photograph of tumors extracted from mice under different treatments for three weeks. Representative images of (D) Hematoxylin and eosin (H&E) staining and (E) Confocal laser scanning microscopy (CLSM) imaging of the liver, kidney, and tumor sections harvested from different treatment groups of BxPC3 tumor-bearing mice. Black arrows showed the toxic damages of tissues. Scale bar = 50 μm. All result represents the mean ± standard deviation (SD) (*P < .05, **P < .01, ***p < .001, and ****p < .0001).
