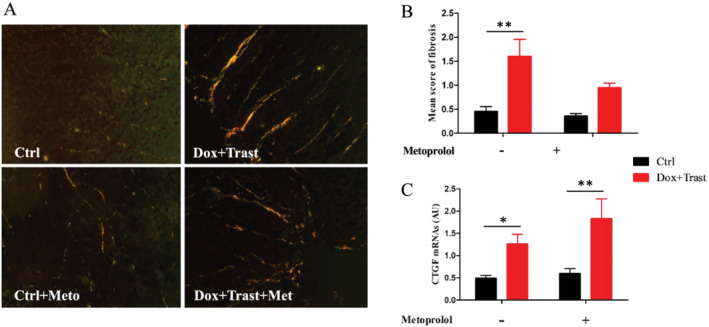
Figure 5.

Chemotherapy‐induced cardiac fibrosis. (A) Representative cardiac section stained with Sirius Red (×20), and score graph of cardiac fibrosis (Ctrl n = 5, Ctrl + Meto n = 5, Dox + Trast n = 5, Dox + Trast + Meto n = 5). (B) Intracardiac CTGF (Connective tissue growth factor) expression (Ctrl n = 9, Ctrl + Meto n = 4, Dox + Trast n = 10, Dox + Trast + Meto n = 6). Values are means ± SEM. **P < 0.01 using two‐way ANOVA test followed by Bonferroni post hoc test.
