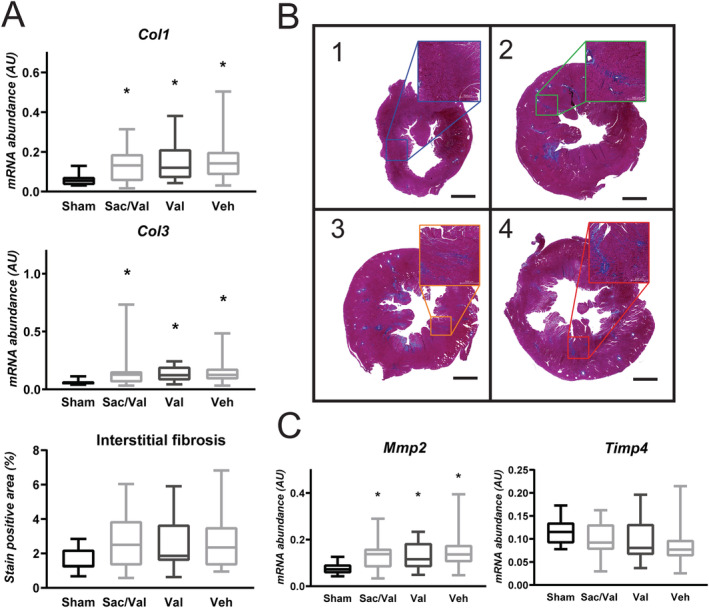
Figure 3.

Fibrosis is increased in left ventricle of all banded groups. (A) Aortic banding (AB) induced fibrosis as measured by ventricular expression of Col1 and 3 (Col1: one‐way ANOVA of log‐transformed data, P = 0.002, n = sham: 14, sac/val: 21, val: 24, veh: 18; Col3: one‐way ANOVA of log‐transformed data, P = 0.002, n = sham: 14, sac/val: 22, val: 24, veh: 18). Interstitial fibrosis was significantly increased compared with sham when all banded groups were pooled (unpaired t‐test with Welch's correction, P < 0.0001, n = sham: 14, AB: 66), while mean interstitial fibrosis was similar in all treatment groups (Kruskal–Wallis test, P = 0.92, n = sac/val: 22, val: 25, veh: 19). (B) Representative photomicrographs from 1, Sham; 2, sac/val; 3, val; 4, veh. Scale bar represents 2000 μm. Adjustment of contrast to match reference image has been applied in all images. (C) Mmp2, a known regulator of collagen turnover, was increased in all banded groups (one‐way ANOVA of log‐transformed data, P = 0.002, n = sham: 14, sac/val: 21, val: 24, veh: 18), while Timp4 showed no significant difference (one‐way ANOVA of log‐transformed data, P = 0.12, n = sham: 14, sac/val: 22, val: 24, veh: 18) (* denotes P < 0.05 vs. sham). Boxplots show median, with whiskers covering 2.5–97.5 percentile.
