
Figure 3.
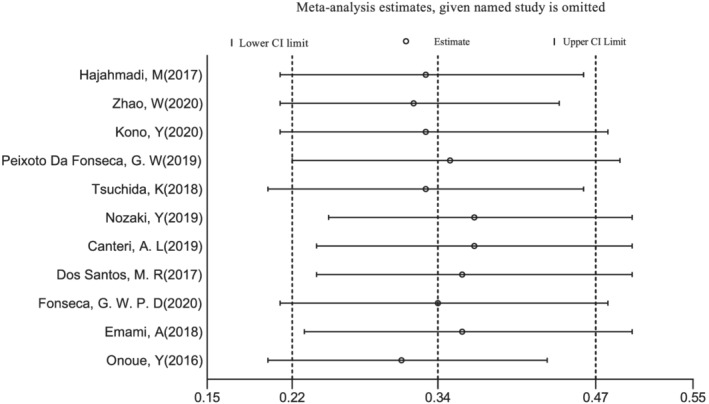
Sensitivity analysis for the effect of individual studies (given named study in the Y axis is omitted) on the pooled prevalence of sarcopenia. CI, confidence interval.
Official websites use .gov
A
.gov website belongs to an official
government organization in the United States.
Secure .gov websites use HTTPS
A lock (
) or https:// means you've safely
connected to the .gov website. Share sensitive
information only on official, secure websites.
Sensitivity analysis for the effect of individual studies (given named study in the Y axis is omitted) on the pooled prevalence of sarcopenia. CI, confidence interval.