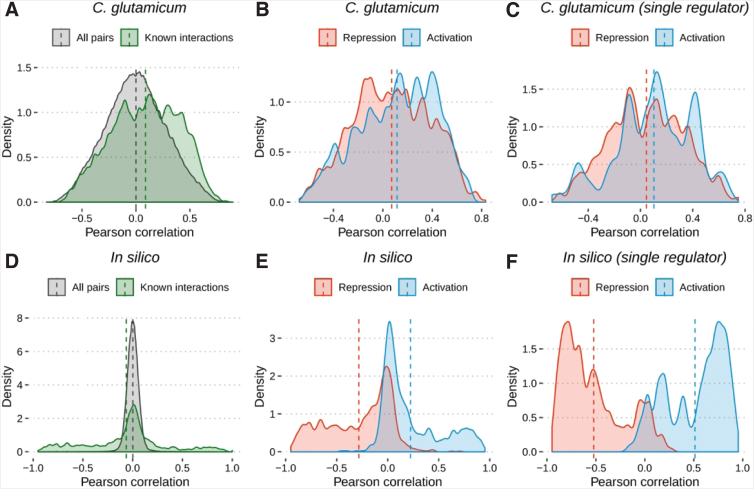
FIG. 1.
Distribution of Pearson correlation for TF and TG/operon pairs. Comparison between the correlation of all possible TF–TG pairs and all known TF–TG pairs. [(A) Corynebacterium glutamicum and (D) in silico]. Comparison between the correlation of known TF–TG pairs separated by interaction role: activation and repression [(B) C. glutamicum and (E) in silico]. Comparison between the correlation of known TF–TG pairs where each TG has only one regulator [(C) C. glutamicum and (F) in silico]. Dashed vertical lines show the mean correlation for each TF and TG/operon pair. TF, transcription factor; TG, target gene.

