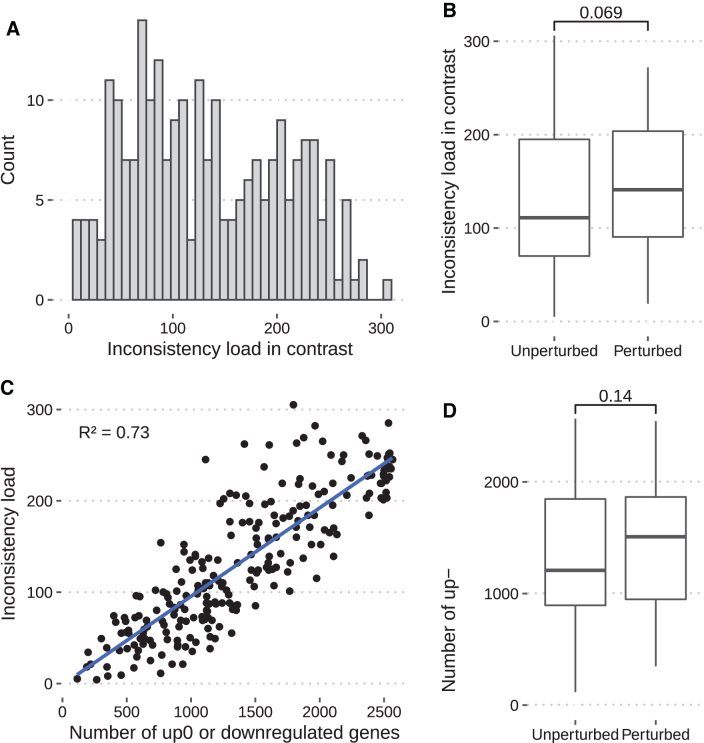
FIG. 3.
Evaluation of the inconsistency load of Corynebacterium glutamicum across contrasts. Distribution of the number of inconsistencies across the 239 contrasts (A). Perturbations (e.g., stress conditions) increase the inconsistency load in contrasts when compared with nonperturbations (B). Relationship between the number of deregulated genes (up or down) and inconsistency load in contrasts (C). Comparison between the number of deregulated genes in the model for the contrasts with and without perturbation (D). The p-values in (B) and (D) were computed using the Mann–Whitney U-test.

