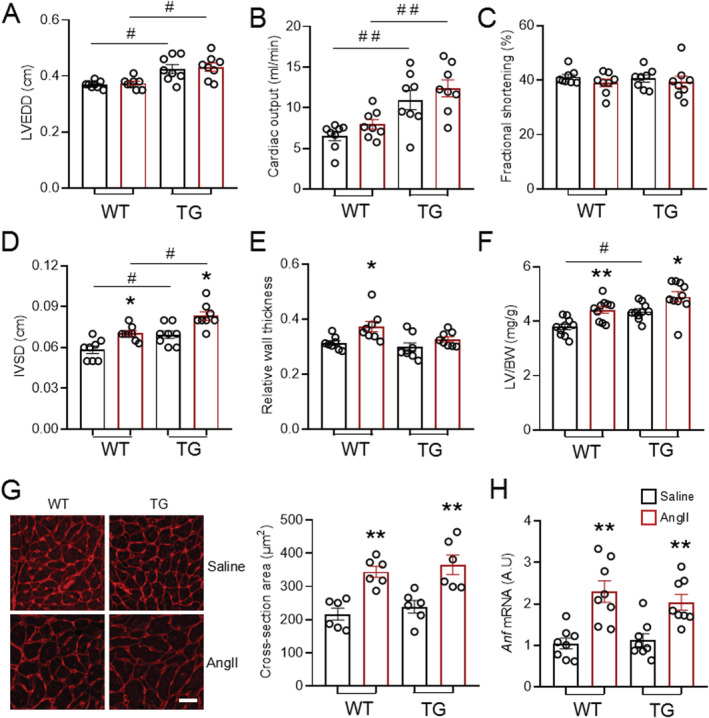
Figure 2.

EndoNox4 TG mice develop similar extent of cardiac hypertrophy as WT in response to AngII stimulation. (A–C) Cardiac function assessed by echocardiography. LVEDD, left ventricular end‐diastolic dimension. n = 8 mice/group. (D–E) Echocardiographic measurement of interventricular septum thickness at end‐diastole (IVSD) and relative wall thickness. n = 8 mice/group. (F) LV weight and body weight ratios. n = 10 mice/group. (G) Representative transverse heart sections for cardiomyocyte area determination stained with WGA. Scale bars: 20 μm. Mean data shown on the right. n = 6 hearts/group. (H) mRNA level of hypertrophic marker atrial natriuretic factor (Anf). n = 8 hearts/group. *P < 0.05, **P < 0.01 compared with respective saline groups; # P < 0.05, ## P < 0.01 compared with respective WT mice; two‐way ANOVA with post‐Bonferroni tests. All data are mean ± SEM.
