
Figure 2.
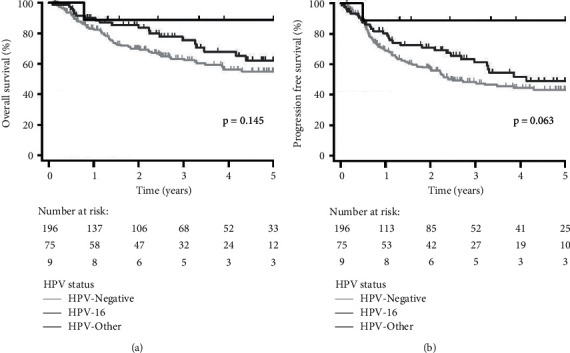
Kaplan–Meier plots stratified by HPV status (HPV-16 vs. HPV-other vs. HPV-negative) for (a) overall survival and (b) progression-free survival for all patients (n = 280).
Official websites use .gov
A
.gov website belongs to an official
government organization in the United States.
Secure .gov websites use HTTPS
A lock (
) or https:// means you've safely
connected to the .gov website. Share sensitive
information only on official, secure websites.
Kaplan–Meier plots stratified by HPV status (HPV-16 vs. HPV-other vs. HPV-negative) for (a) overall survival and (b) progression-free survival for all patients (n = 280).