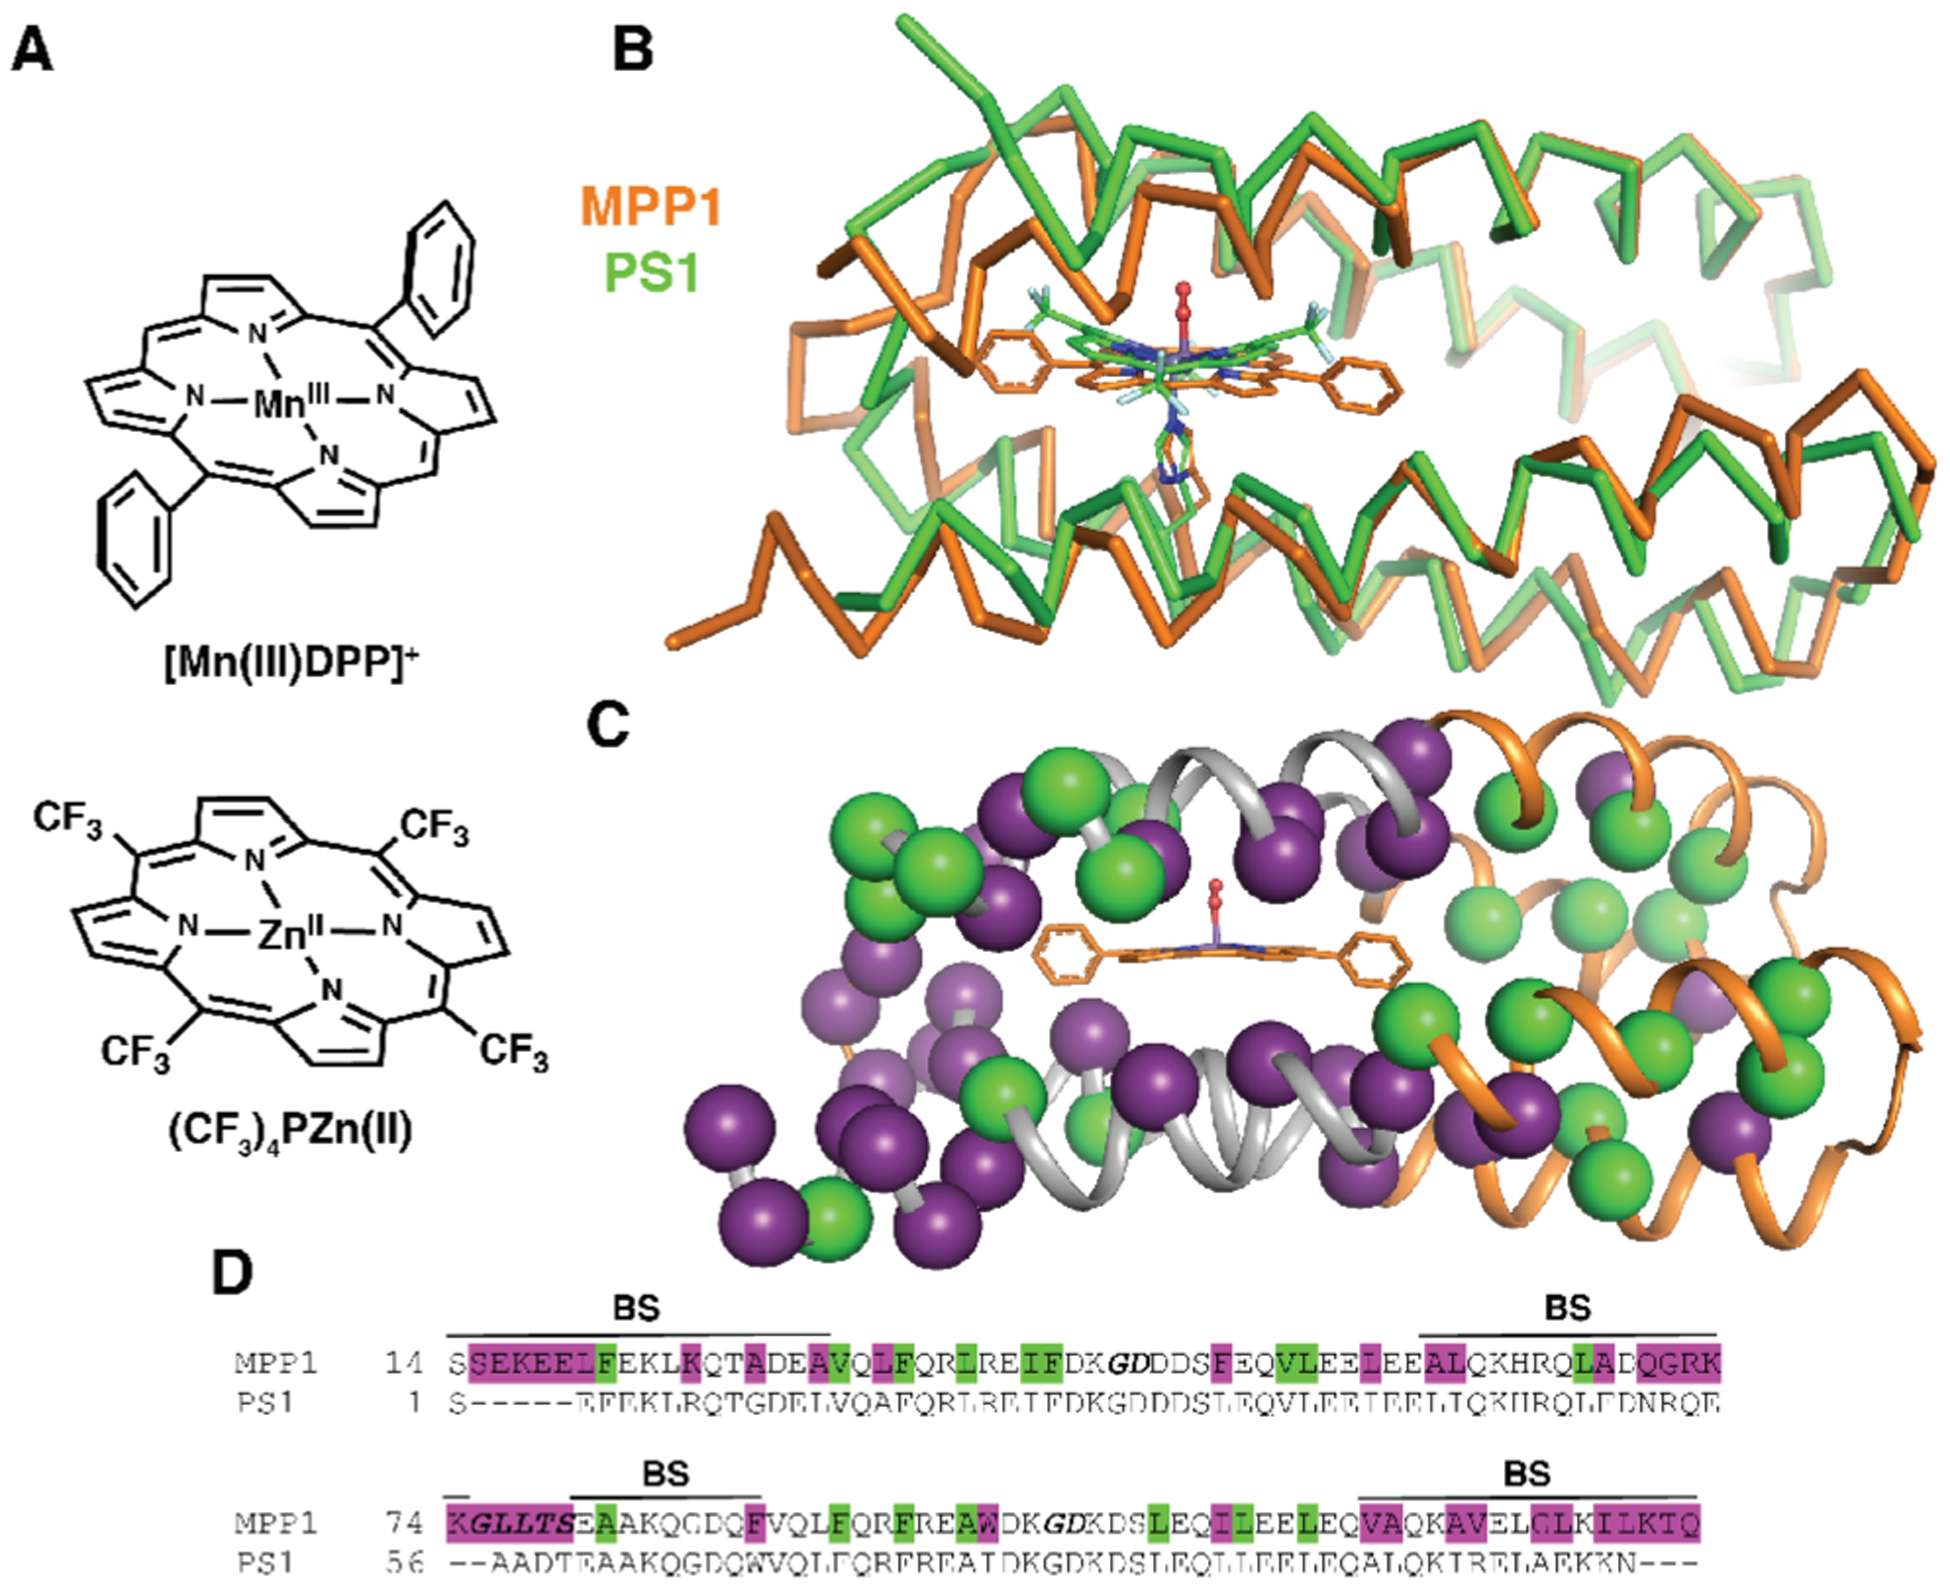
Figure 2.

Comparison of MPP1 design to previously designed PS1. (A) ChemDraw representations of cofactors used for design, [Mn(III)DPP]+ (this work) and (CF3)4PZn(II) (previous work). (B) A ribbon representation of the MPP1 design overlaid with the NMR structure of PS1 illustrating the differences in backbone length and position. (C) A cartoon representation of the MPP1 design showing the changes in sequence relative to PS1 (purple spheres) to accommodate the new cofactor and residues that were allowed to change but did not (green spheres). (D) Sequence alignment of MPP1 and PS1 colored as in (C) with the binding site region designated as BS and loop regions bolded and italicized.
