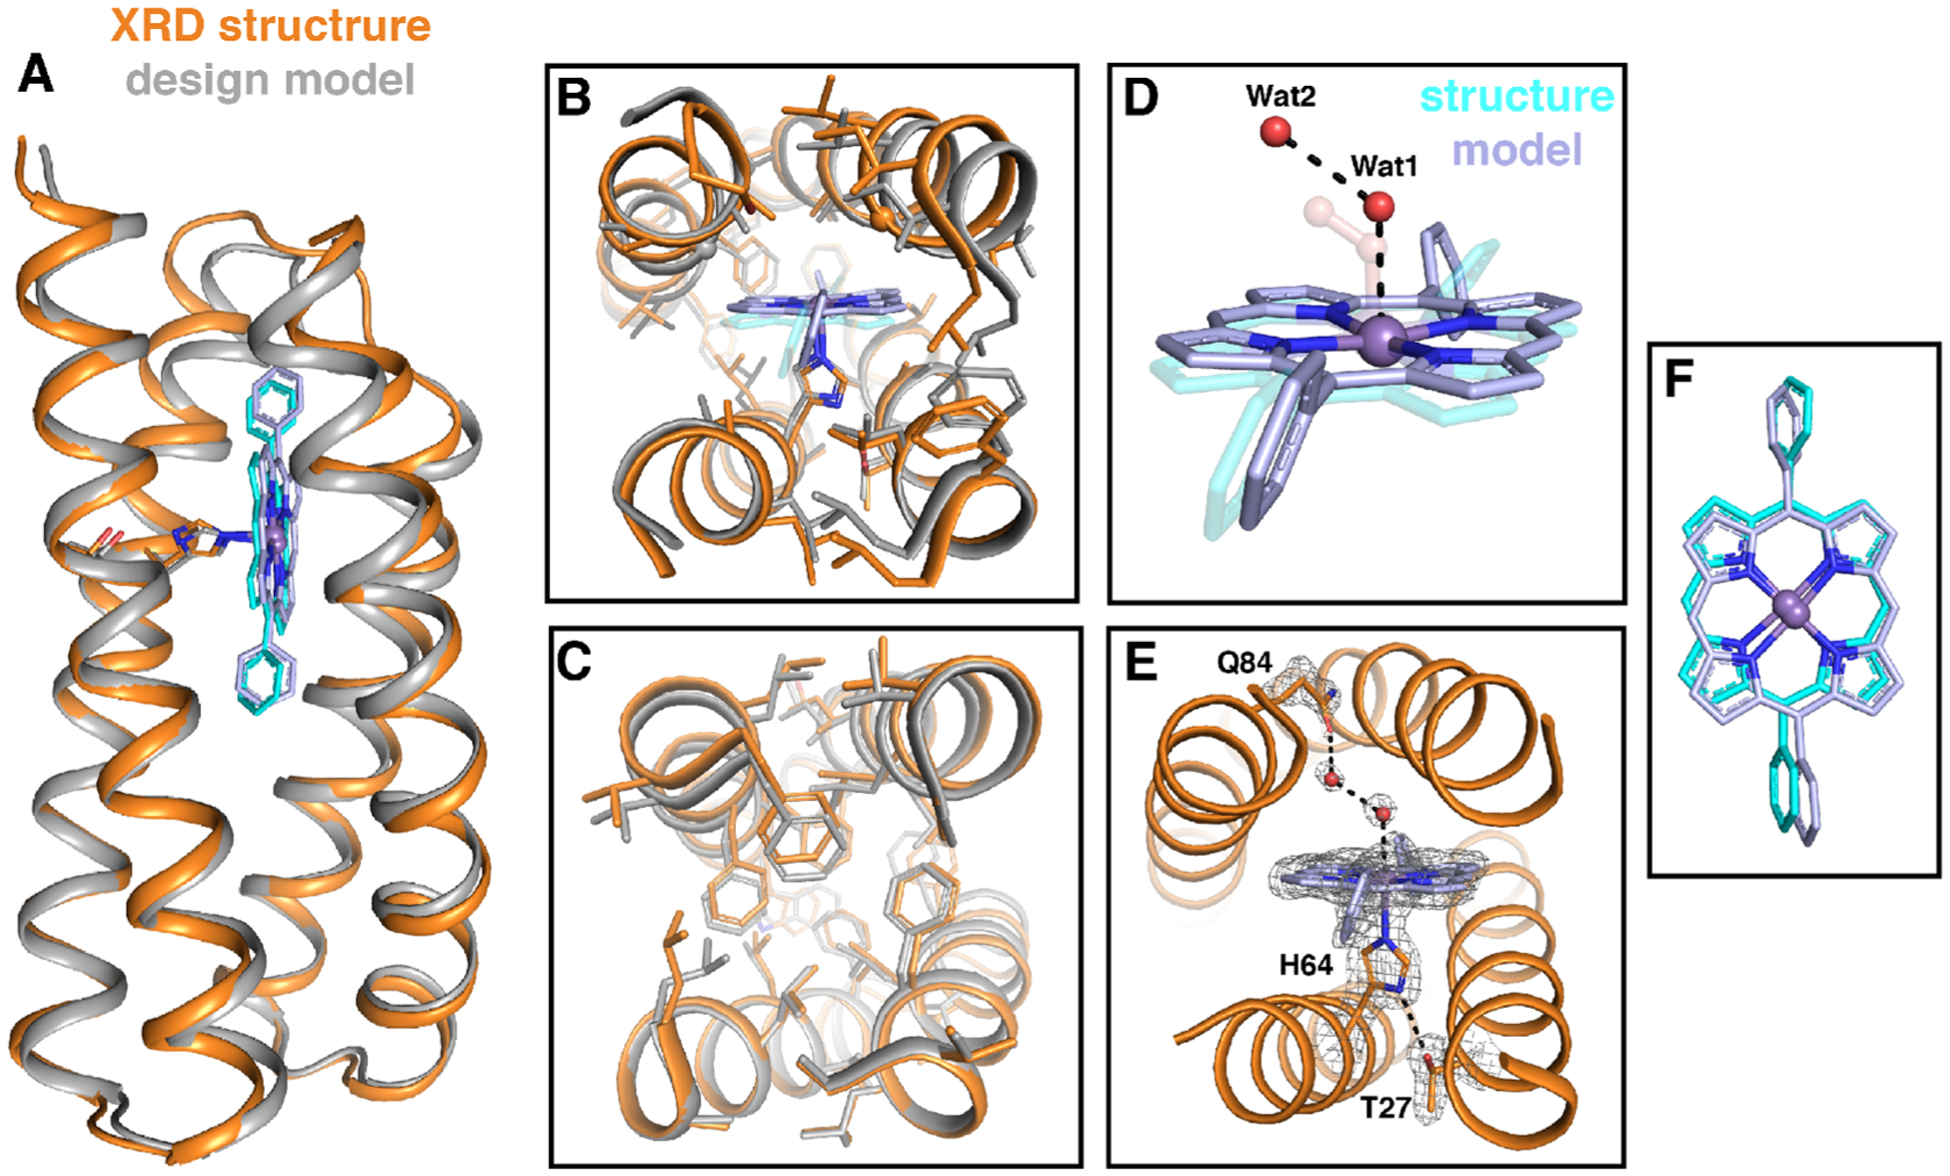
Figure 7.

Structural comparison of the designed model of MPP1 (gray) and the crystal structure (PDB: 7JRQ, orange). (A) Cartoon representation showing an extremely good backbone match between the design and structure (0.6 Å all backbone RMSD). Comparisons of the binding site region (B) and folded core region (C). Comparison of the placement of Wat1 and Wat2 (red spheres) relative to the dioxygen unit in the design (transparent) (D) and extended H-bonding network from the binding site to the surface via a water network (E). The positions of T27, H64, MnDPP, Wat1, Wat2, and Q84 in (E) are indicated by the F0–Fc omit map (gray mesh, contoured at 3σ). (F) Comparison of observed cofactor placement (gray) relative to the model (cyan). Glycine residues are shown as Cα spheres.
