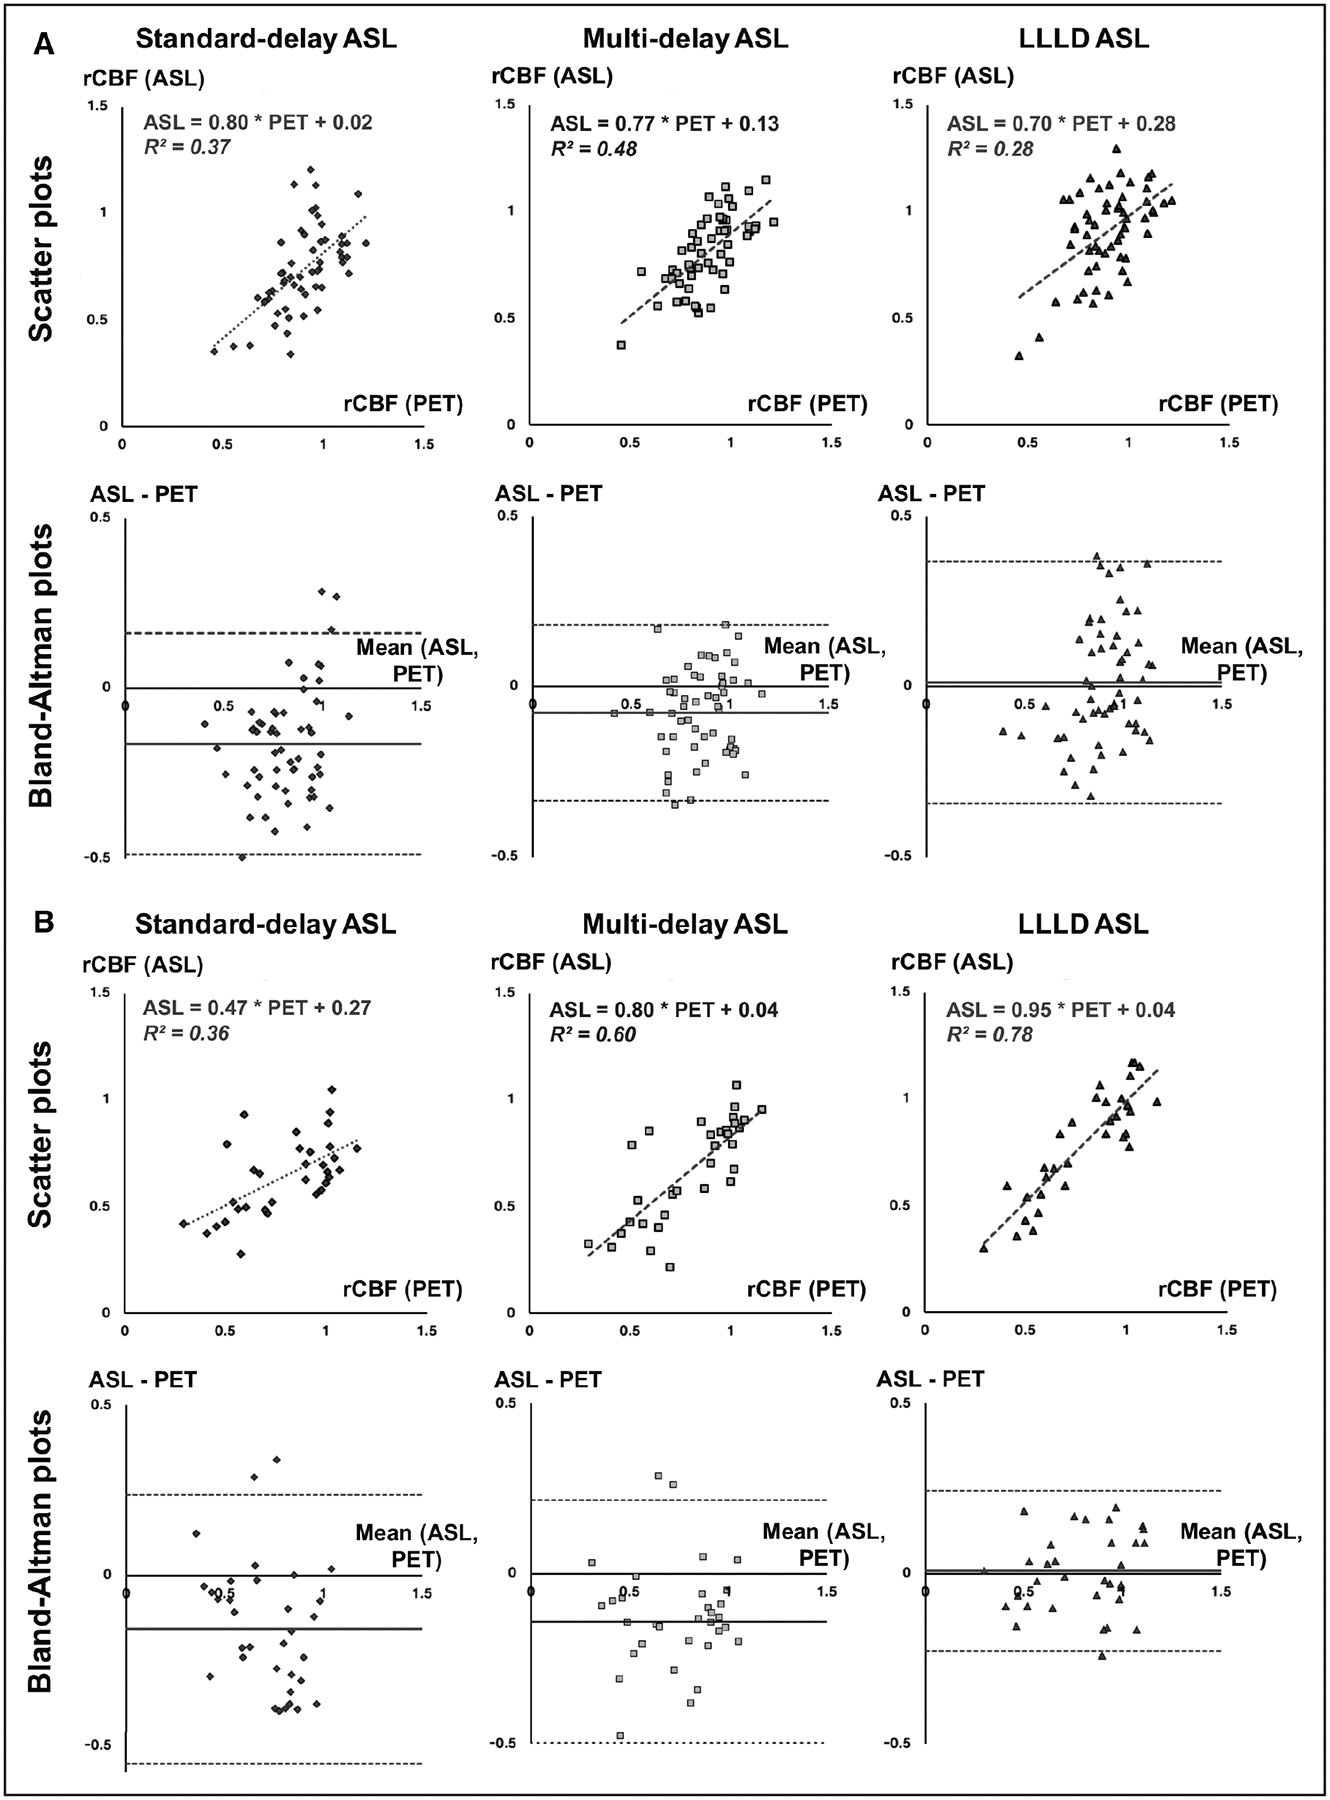
Figure 4.

Linear regression analysis to evaluate the agreement between standard, multidelay, and long-label long-delay (LLLD) arterial spin labeling (ASL) with the positron emission tomography (PET) reference standard. Scatter plots of relative cerebral blood flow (rCBF) with linear fits and Bland–Altman plots (mean vs difference) are shown for (A) regions of moderate time-to-maximum (Tmax) delays (n=56) and (B) regions of severe Tmax delays (n=33) identified on dynamic susceptibility contrast MRI.
