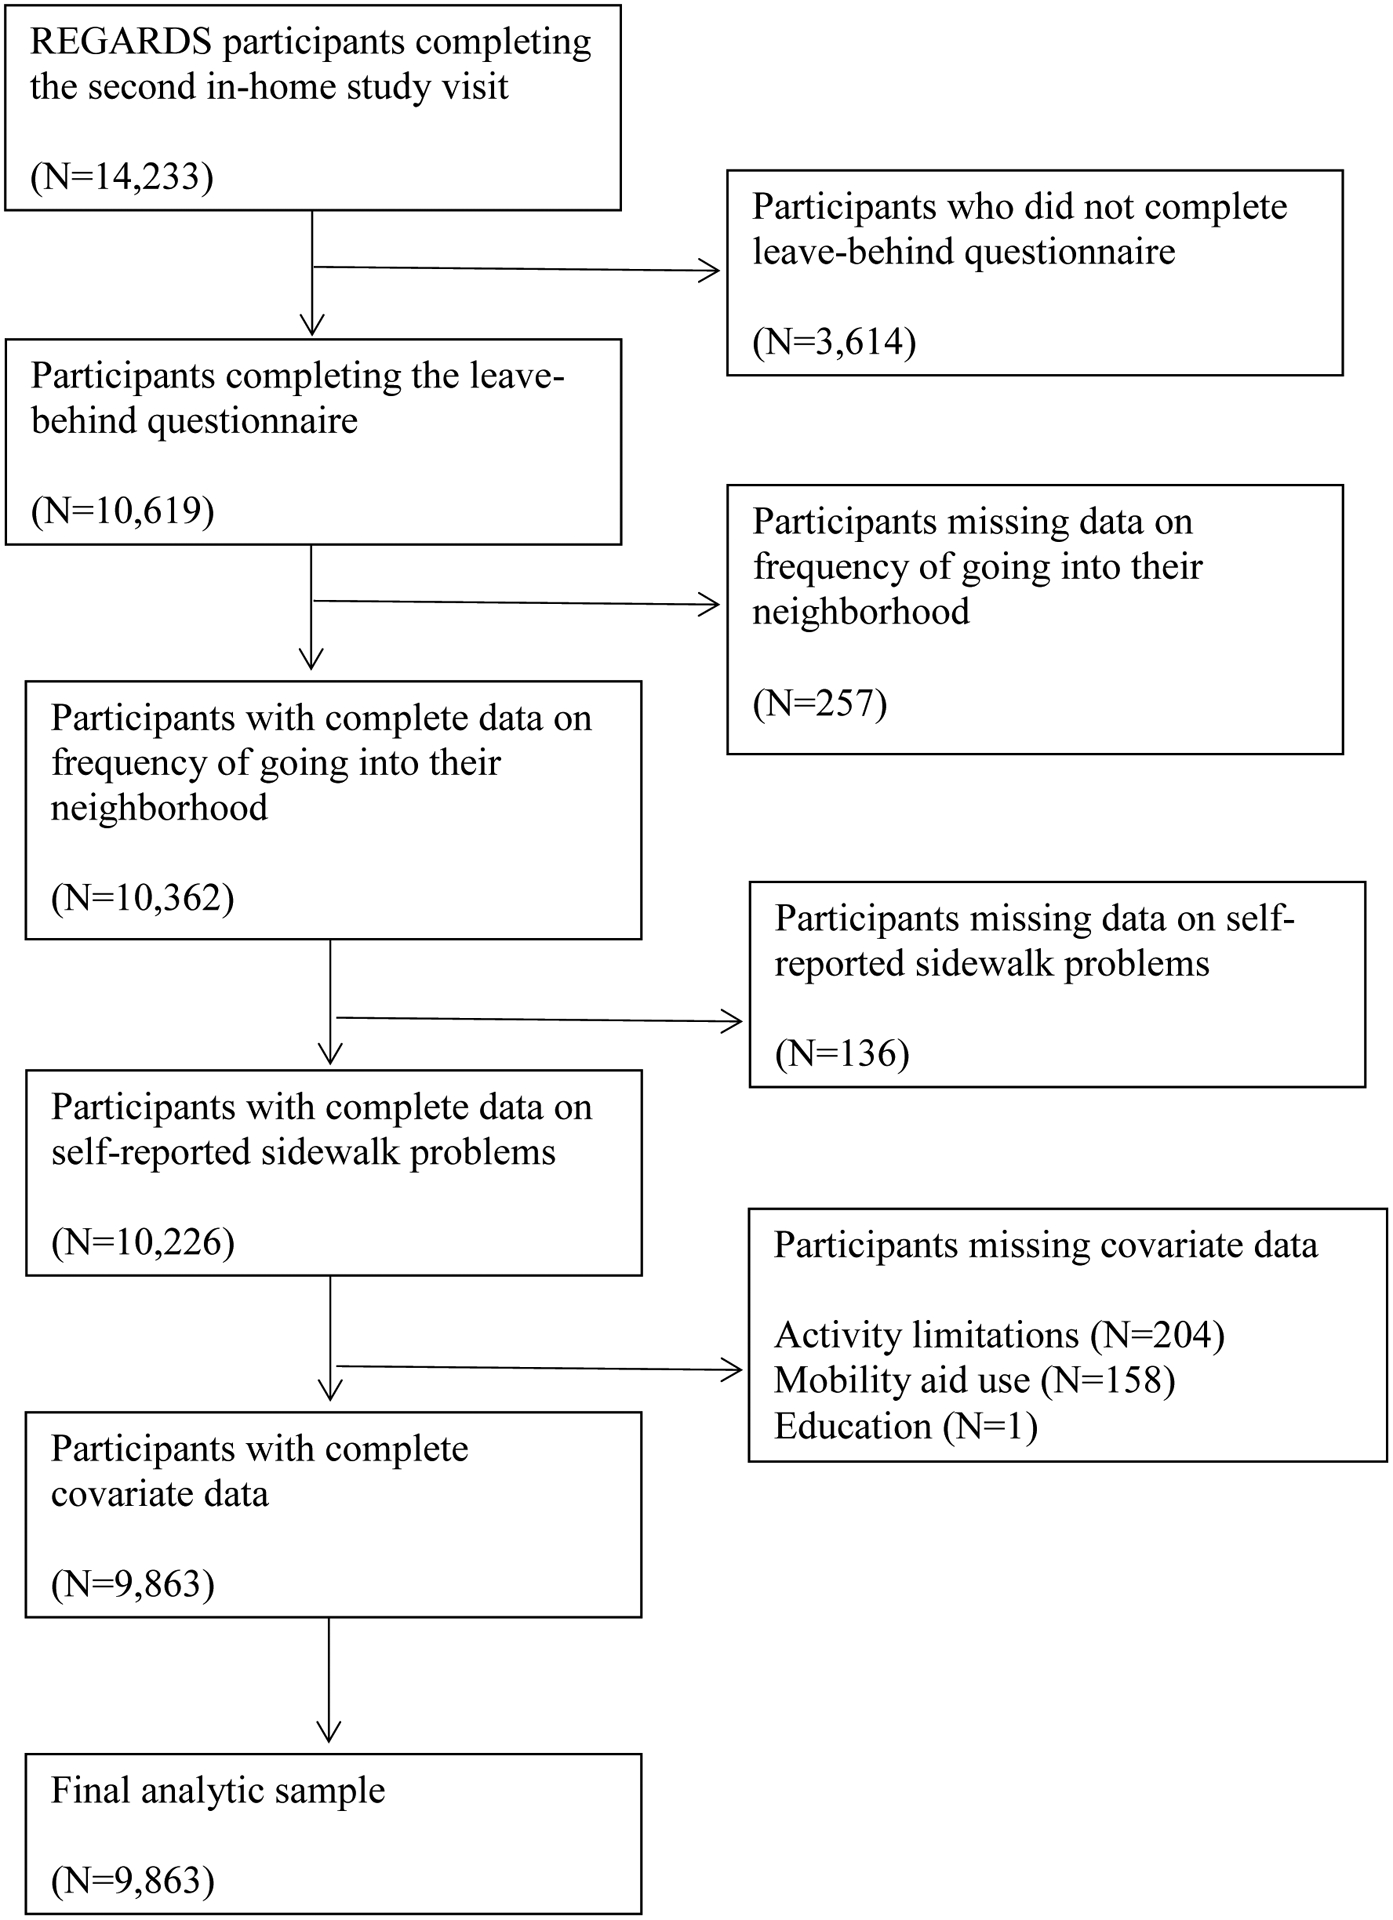
Figure 1.

Flow chart of number of participants included and excluded from the analytic sample, and detailed reason for exclusion of participants.
Note: REGARDS = REasons for Geographic and Racial Differences in Stroke

Flow chart of number of participants included and excluded from the analytic sample, and detailed reason for exclusion of participants.
Note: REGARDS = REasons for Geographic and Racial Differences in Stroke