Figure 4.
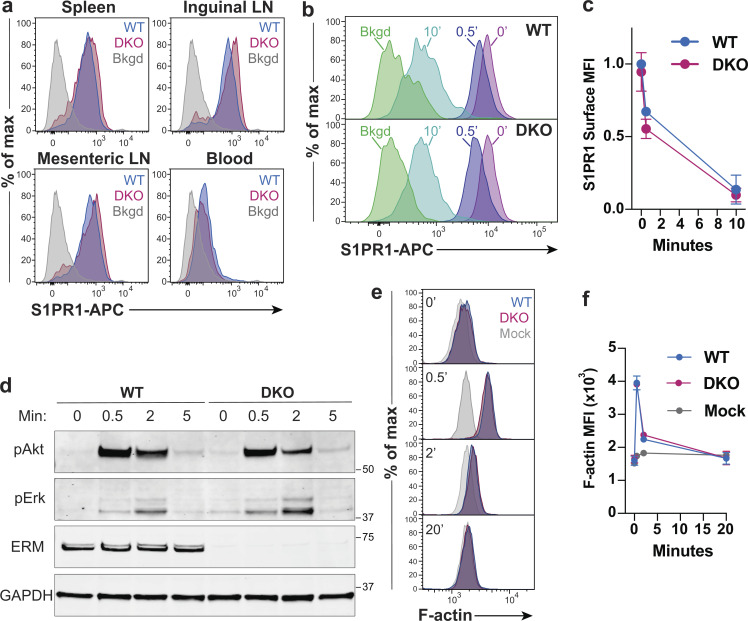
ERM proteins are dispensable for S1PR1 expression, endocytosis, and signaling. (a) Ex vivo surface expression of S1PR1 on WT and DKO naive CD4+ T cells (CD4+, CD62LHi, CD44Low) from the spleens, lymph nodes (LNs), and blood. Bkgd refers to WT CD4+CD8+ thymocytes stained in parallel. Representative flow panels from three independent experiments are shown. (b and c) Ligand-induced S1PR1 endocytosis. WT and DKO naive CD4+ T cells were cultured overnight in media with 10% CS-FBS, stimulated with S1P (10 nM) for 0, 0.5, or 10 min, stained for surface S1PR1, and analyzed by flow cytometry. Bkgd refers to cells stained without primary anti-S1PR1 antibody. Pooled data from four independent experiments normalized to WT levels before stimulation are shown as means ± SD and compared at each time point using t tests (two-sided) and the Holm-Sidak correction for multiple comparisons. (d) S1P-induced signaling. WT and DKO naive CD4+ T cells (previously cultured overnight in media with 10% CS-FBS) were stimulated with S1P (1 nM), lysed after 0, 0.5, 2, and 5 min, and immunoblotted for phospho-Erk (pErk; Thr202/Tyr204), phospho-Akt (pAkt; Ser473), total ERM proteins, and GAPDH. The blot shown is representative of three independent experiments. (e and f) S1P-induced actin polymerization. WT and DKO naive CD4+ T cells (previously cultured overnight in media with 10% CS-FBS) were stimulated with S1P (1 nM) for 0, 0.5, 2, or 20 min, fixed, stained with phalloidin-AF488, and analyzed by flow cytometry. Mock treated cells were handled in parallel, with addition media alone. Representative plots and pooled data from four independent experiments are shown as means ± SD and compared at each time point using multiple t tests (two-sided) with the Holm-Sidak correction for multiple comparisons. Data distribution was assumed to be normal, but this was not formally tested. No statistically significant differences were observed between WT and DKO T cell responses. Max, maximum; MFI, mean fluorescence intensity.

