Figure 9.
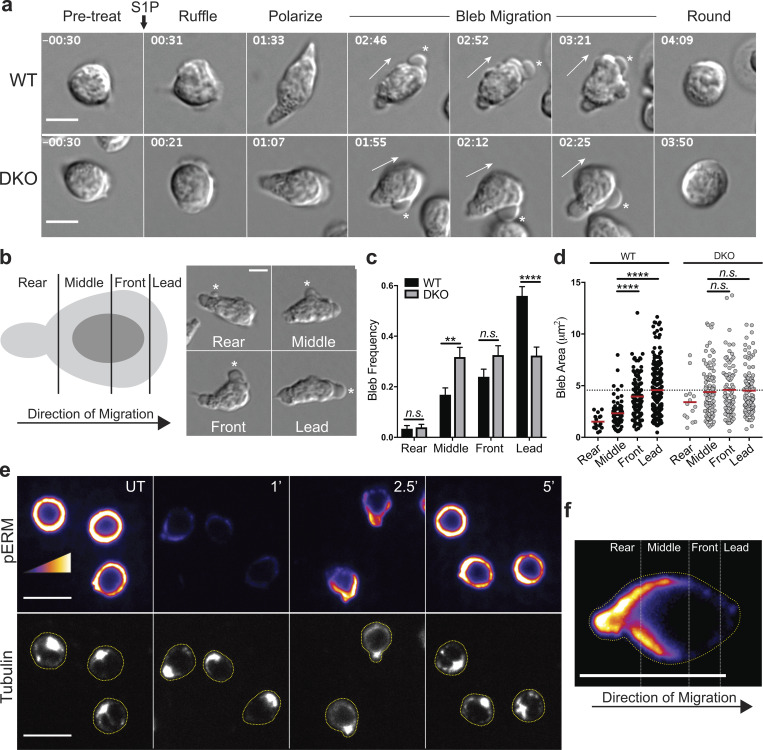
ERM proteins facilitate S1P-induced migration by limiting blebs to the leading edge. (a) Representative S1P-induced bleb-based migration for WT and DKO naive CD4+ T cells. Cells were cultured overnight in media with 10% CS-FBS and imaged by DIC microscopy before and after stimulation with S1P (100 nM). Full arrows indicate direction of migration and asterisks indicate blebs. Time in min:s relative to S1P stimulation. Scale bar, 5 μm. (b) An illustration depicting a cell divided along the axis of migration and an example of S1P-induced blebs occurring in each region (asterisks). (c and d) Bleb frequency and area along the axis of migration. Individual cells were tracked during S1P-induced migration, blebs were binned into the appropriate region, and area was measured. (c) More than 50 cells pooled from three independent experiments shown as the mean ± SEM compared using multiple t tests (two-sided) and the Holm-Sidak correction for multiple comparisons. Data distribution was assumed to be normal, but this was not formally tested. (d) Each dot corresponds to an individual bleb (>300 per group), and means compared (red horizontal bars) using a Kruskal-Wallis (nonparametric) one-way ANOVA. Dashed line at WT lead mean. (e) Active ERM protein localization during S1P migratory responses. WT naive CD4+ T cells (previously cultured overnight in media with 10% CS-FBS) were stimulated with S1P, fixed at the indicated times after S1P addition (minutes), stained for phospho-ERM proteins (pERM; top) and tubulin (bottom), and imaged by confocal fluorescence microscopy. UT, untreated. Scale bar, 10 μm. Cells are outlined in yellow in the tubulin channel. Representative images from three independent experiments. (f) A representative cell from the 2.5-min time point in e enlarged and oriented in the same direction as in b; scale bar, 10 μm. n.s., P > 0.05; **, P < 0.01; ****, P < 0.0001.

