Figure S2.
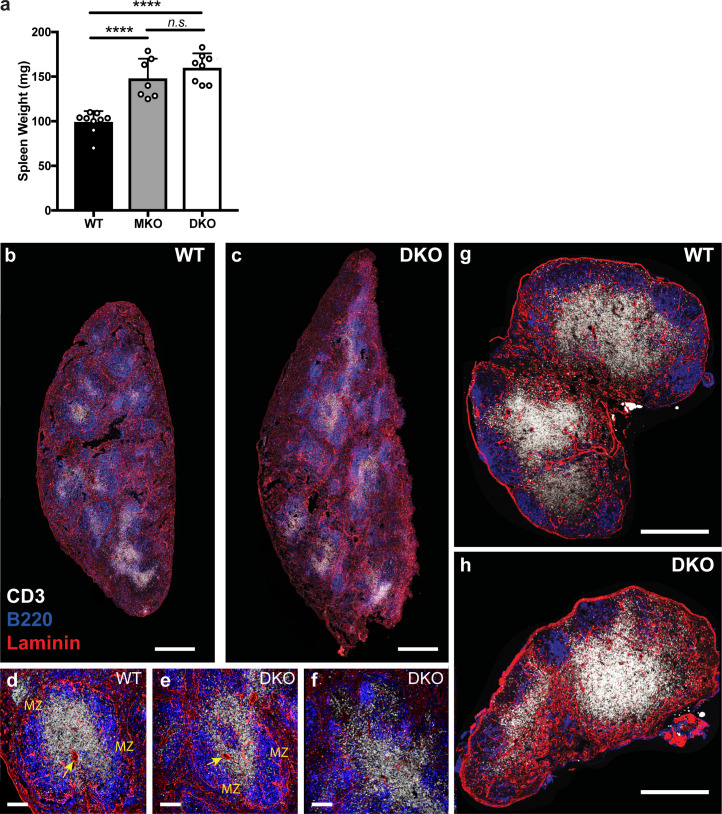
Organization of secondary lymphoid organs in DKO mice. (a) Weight of spleens isolated from WT, MKO, and DKO mice. Data are displayed as means ± SD. Each dot corresponds to an individual mouse; n = 7–9 mice per group. Means were compared using an ordinary one-way ANOVA. Data distribution was assumed to be normal, but this was not formally tested. (b–h) Immunofluorescence histology of spleens and lymph nodes from WT and DKO mice stained with antibodies against CD3 (white), B220 (blue), and laminin (red). (b and c) Confocal tile scans of whole spleens from WT and DKO mice; scale bar, 500 µm. (d–f) Magnified regions of spleens with the central arterioles (arrows) and marginal zones (MZ) labeled. Normal lymphocyte organization in WT and DKO spleens shown (d and e) as well as a representative region of poor organization in DKO spleen (f). Scale bar, 100 µm. (g and h) Confocal tile scans of whole inguinal lymph nodes from WT and DKO mice. Scale bar, 500 µm. n.s., P > 0.05; ****, P < 0.0001.

