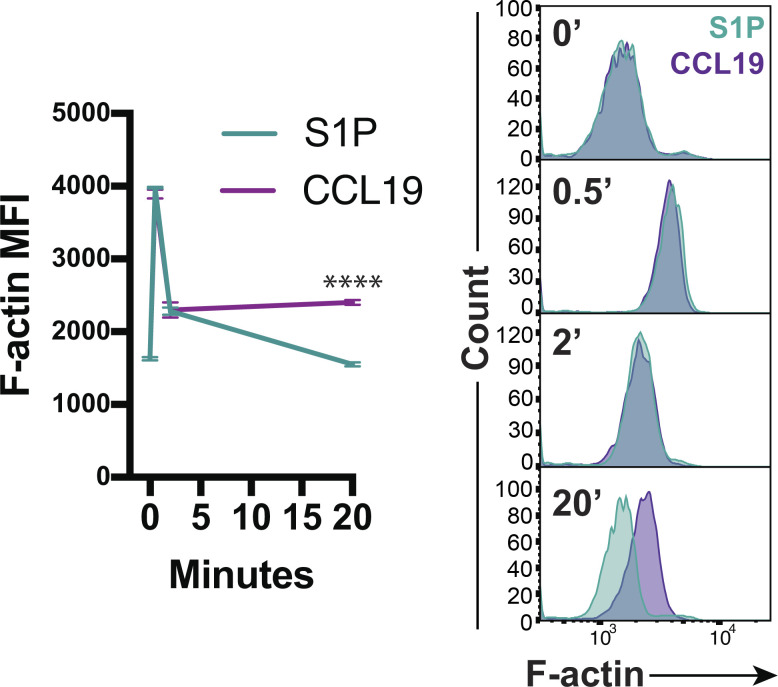
Figure S3.
Actin polymerization kinetics for S1P versus chemokine stimulation. WT naive CD4+ T cells cultured overnight were stimulated with S1P (1 nM) or CCL19 (100 ng/ml), fixed after 0, 0.5, 2, or 20 min, stained for F-actin, and analyzed by flow cytometry. Representative plots (gated on CD4+ singlets) and pooled data from three independent experiments shown as means ± SD and compared at each time point using multiple t tests (two-sided) with the Holm-Sidak correction for multiple comparisons. Data distribution was assumed to be normal, but this was not formally tested. MFI, mean fluorescence intensity. ****, P < 0.0001.

