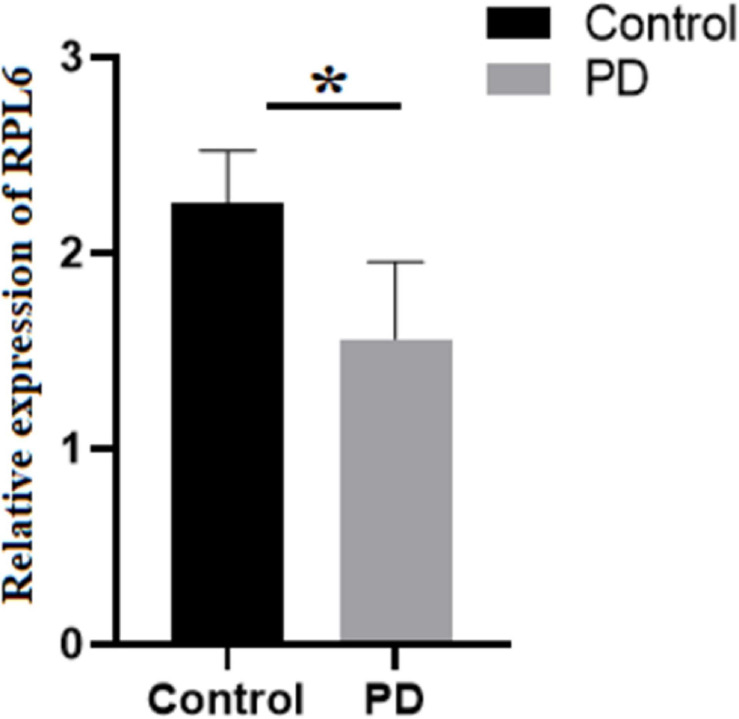
FIGURE 6.
Relative expression: Gene expression analysis of 60S ribosomal protein L6 (RPL6) in peripheral blood mononuclear cells (PBMCs) of control (black) and PD (gray). The columns represent the average gene expression with standard deviation error bar, and asterisk denotes statistical significance with p-value ≤ 0.05.

