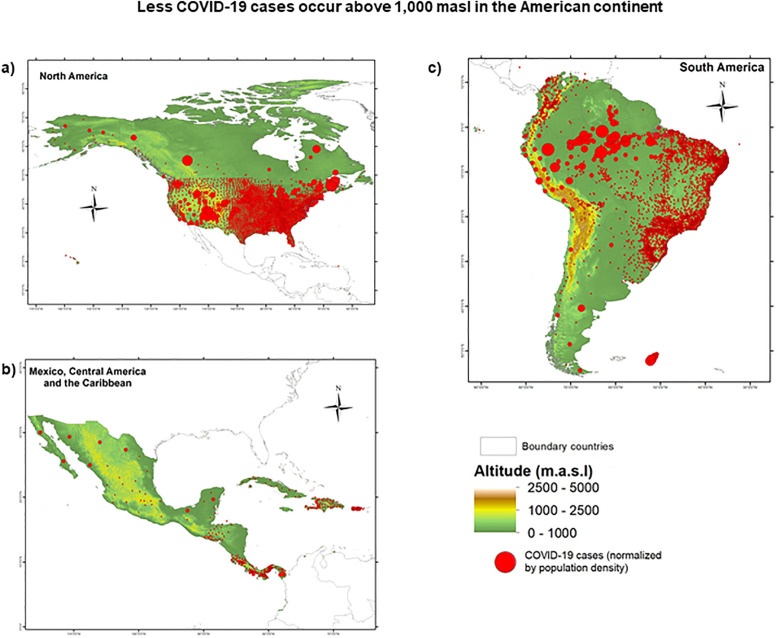
Fig 2. Geographic and altitudinal distribution COVID-19 in a) North America, b) Central America and c) South America.
Red circles represent COVID-19 positive cases; the radius of the circle is relative to the normalized number of cases (cases/population density) in the location. The geographical coordinates and epidemiological data were retrieved on May 23, 2020 as described in the methods section. The final database used to produce these maps is available at https://doi.org/10.6084/m9.figshare.12685478. Maps for the 23 studied countries are available at https://doi.org/10.6084/m9.figshare.12685664.v1.

