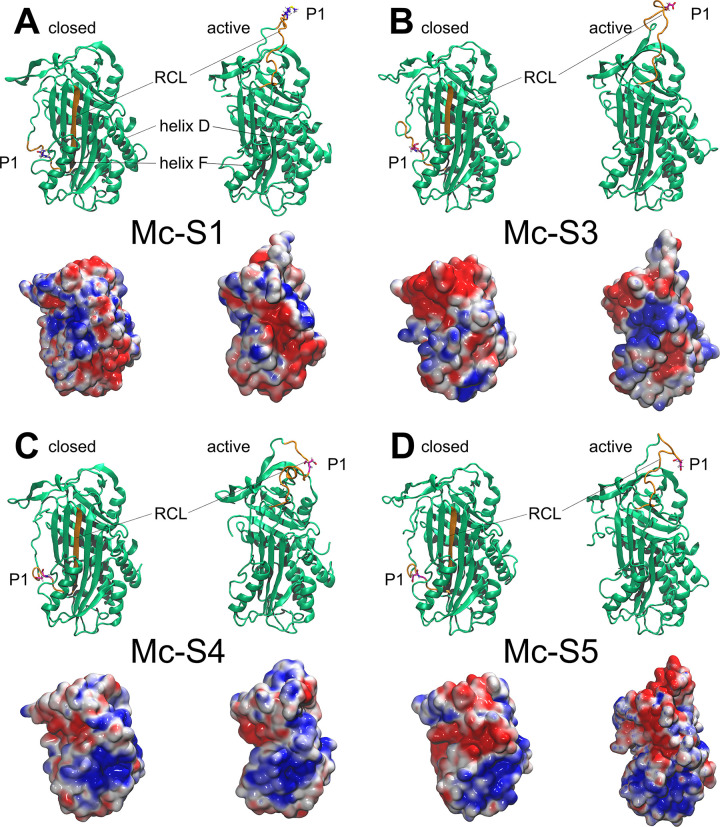
Fig 4.
Ribbon and electrostatic surface models of serpins Mc-S1 (A), Mc-S3 (B), Mc-S4 (C) and Mc-S5 (D) of Myxobolus cerebralis. Both the closed (latent) and the active (native) conformations of proteins are presented. The reactive center loop (RCL) is labeled and highlighted in orange. The cleavage site in amino acid position P1 is in atomic thin tube representation. On the electrostatic surface models, red color represents regions with a potential value less than -2.0 kT; white color shows 0.0; blue shows regions greater than +2.0 kT.

