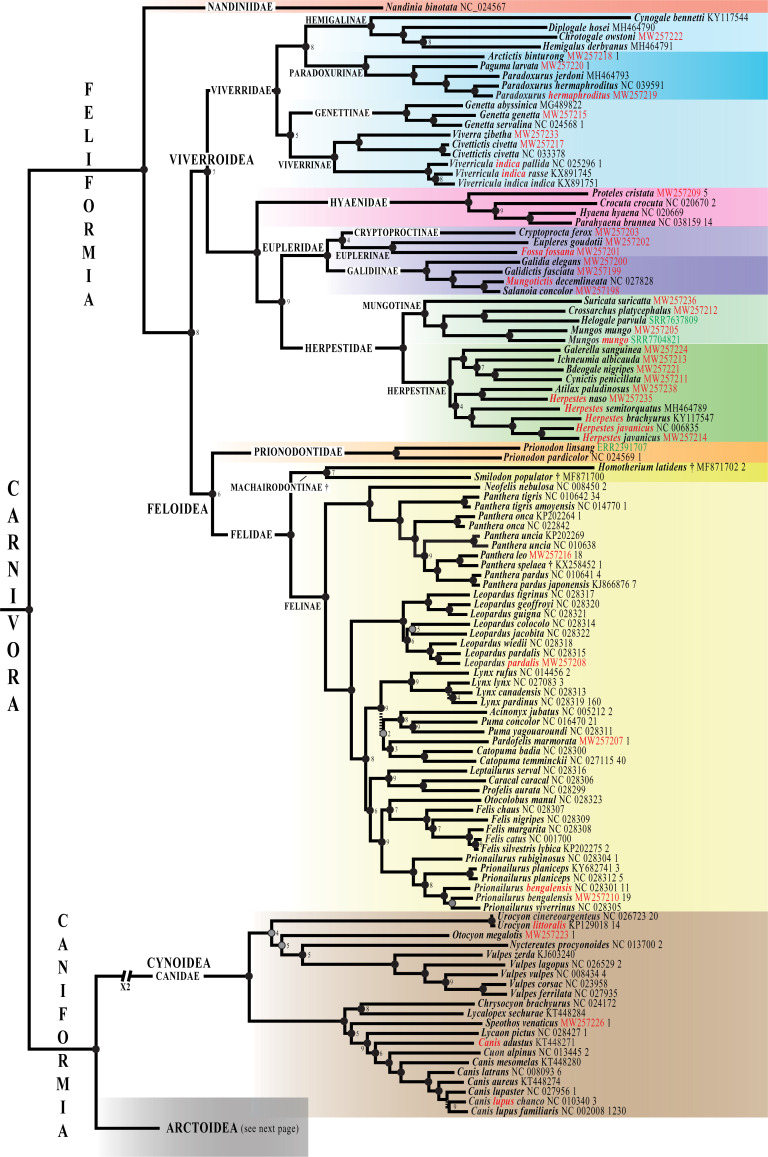
Fig 5. Phylogeny of Carnivora based on mitogenomes.
The Bayesian tree was reconstructed using the mtDNA dataset (220 taxa and 14,892 bp) and GTR+I+G model. The two outgroup species are not shown. Species names follow the classification of the IUCN [1]; the taxa written in red highlight the taxonomic issues discussed in the main text. The accession numbers of the 42 mitogenomes of Carnivora specially sequenced for this study are indicated in red. The eight mitogenomes here assembled from SRA data are shown in green. The blue circle associated to Mustela nudipes MH464792 indicates that the mitogenome was originally misassigned to Viverra tangalunga. Fossil species are followed by the symbol “†”. For each terminal taxon, the number of similar mitogenome(s) found in GenBank (pairwise distance < 1%) is indicated after the accession number. Dash branches indicate nodes supported by posterior probability (PP) < 0.95. Black circles indicate nodes that are also monophyletic in the two following trees: SuperTRI bootstrap 50% majority-rule consensus tree; and Bayesian tree obtained from the analysis of the mtDNA-Tv dataset and JC69+I+G model. Grey circles show nodes that are not found to be monophyletic with one of the two methods detailed above. White circles indicate nodes that are not monophyletic in both mtDNA-Tv and SuperTRI bootstrap consensus trees. No information was provided for the nodes highly supported by the SuperTRI analyses, i.e. which were found monophyletic in all the 10 Bayesian trees reconstructed from the 10 half-overlapping sub-datasets of the mtDNA dataset. For nodes less supported by the SuperTRI analyses, the number of Bayesian trees (< 10) showing the nodes is indicated.

