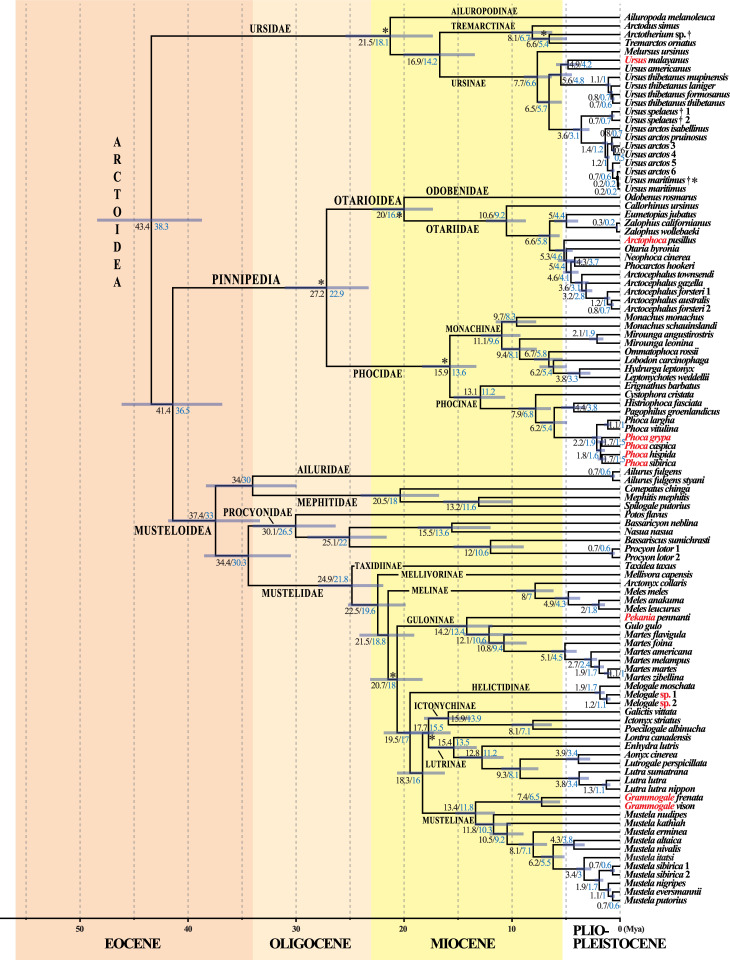
Fig 8. A molecular timescale for carnivoran evolution.
The estimates of divergence time were calculated under BEAST v.2.4.7 using the GTR+I+G model on the mtDNA dataset. The asterisks show the 21 fossil calibration points used for molecular estimation (see Table 1 for details). The chronogram, mean ages (values in black) and associated 95% confidence intervals (grey bars) were inferred using a uniform prior distribution for fossil calibration points (“U approach”). For comparison, the values in blue are mean ages estimated using a log normal prior distribution for fossil calibration points (“L approach”; see main text for details and discussion). Species names follow the classification of the IUCN [1]; the name of the taxa written in red have been changed following our results which suggest these taxonomic changes (see the discussion for details).

