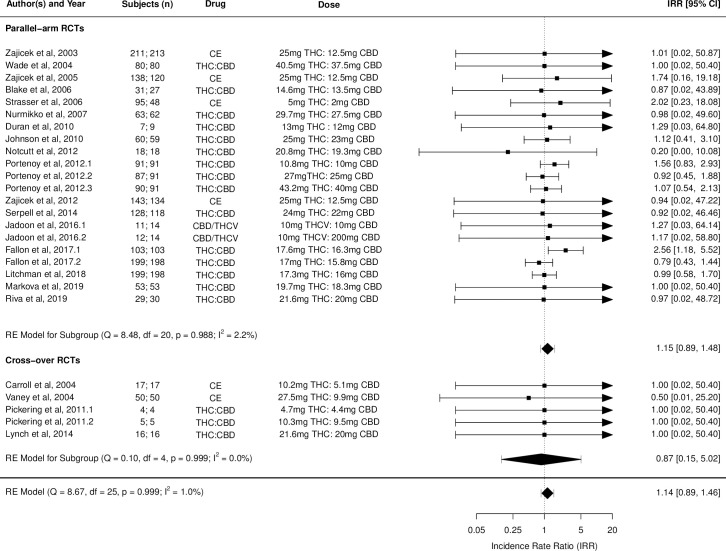
Fig 13. Forest plot of all deaths: THC:CBD studies.
Numbers under the “Subjects (n)” column refer to analysed participants from the active and control intervention arms, respectively. CBD, cannabidiol; CE, cannabis extract; IRR, incident rate ratio; RCT, randomised clinical trial; THC, delta-9-tetrahydrocannabinol.

