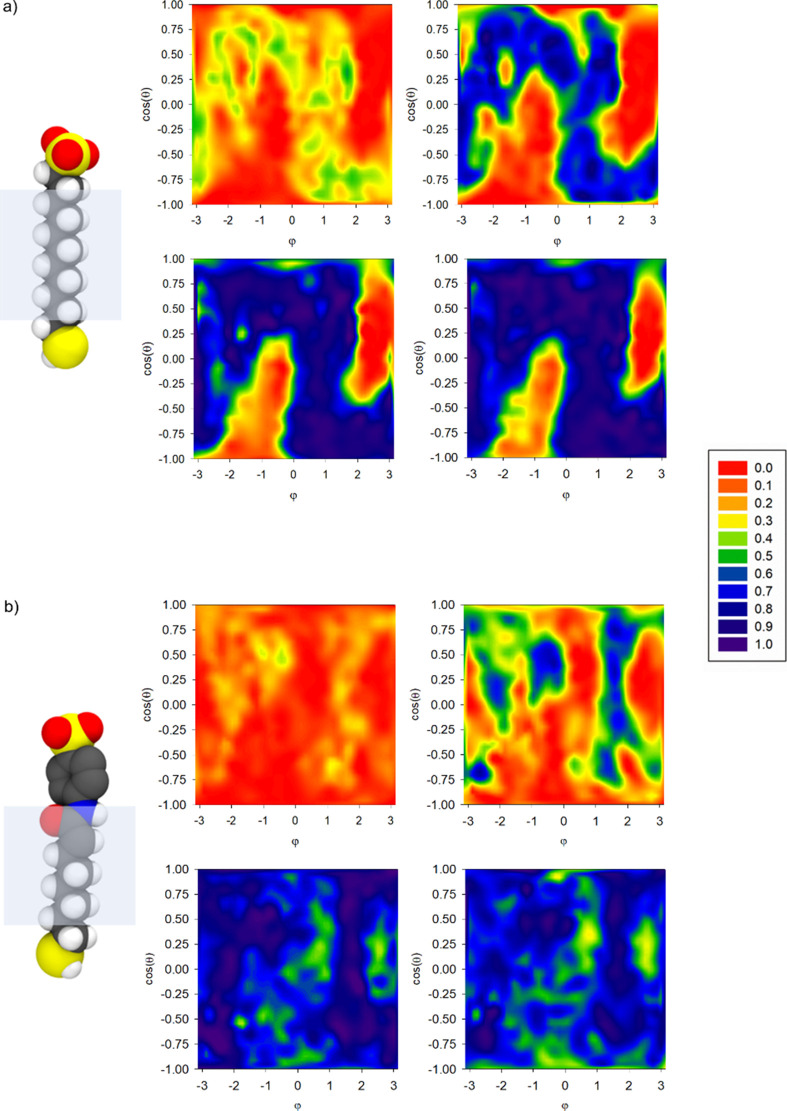
Figure 6.
Normalized water distribution at increasing distance from the gold surface (∼4 to 10 Å up-left to right-down panels) for (a) S1-AuNP and (b) S3-AuNP. The graphs plot the distribution of the atom (oxygen of water or carbon of thiols) closest to spherical surfaces (centered on the gold core and placed at increasing distances from the NP core) shown as a two-dimensional projection of the sphere surface (x axis, the azimuthal angle φ; y axis, the cosine of the polar angle θ). A value of 1 indicates that an oxygen atom of a water molecule is always the closest; if it is equal to 0, it indicates that a carbon atom of a chain is always the closest.

