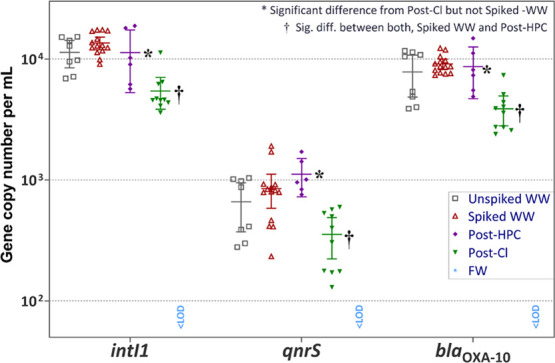
Figure 1.

Gene copy numbers of water samples per milliliter of treated water. For chlorination (post-Cl), all three genes were statistically significantly lower than the starting wastewater (spiked WW) and post-HPC, while post-HPC was only different from post-Cl. Error bars = 95% confidence interval (C.I.).
