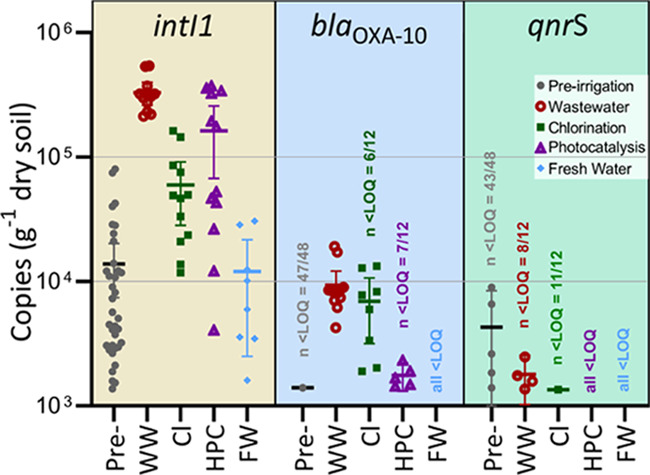
Figure 2.

Gene copy numbers of soil samples per gram of dry soil. Preirrigation samples (in gray) represent the soil before they started receiving their respective water type in each of the four groups (WW, Cl, HPC, FW). These four groups all show the soil levels after 38 days of irrigation. For IntI1, both Cl and HPC are statistically significantly lower than wastewater irrigation, while for blaOXA-10, only HPC was lower. For both genes, soil levels after irrigations were statistically significantly higher than preirrigation levels. Error bars = 95% C.I.
