Figure 1.

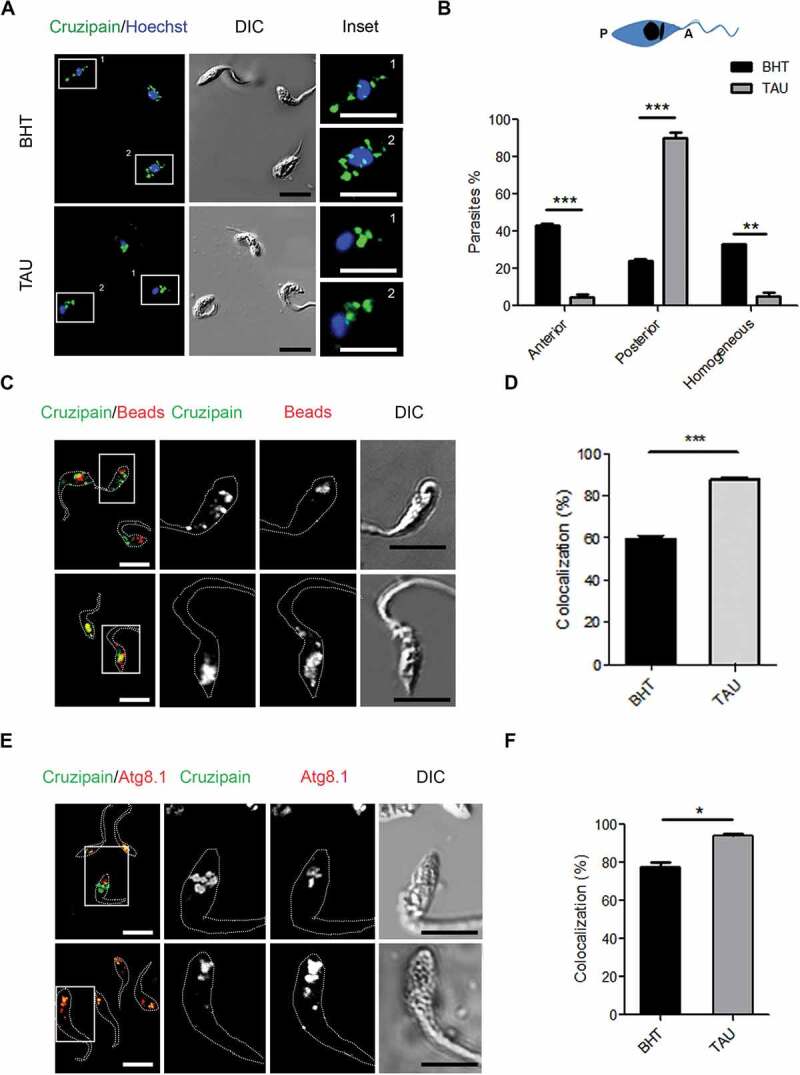
Induction of autophagy accumulates cruzipain in reservosomes. (A) Immunofluorescence analysis of cruzipain distribution in epimastigotes (Y WT strain) exposed to the first stage of metacyclogenesis under optimal nutritional conditions (BHT) or nutritional stress as an autophagy stimulus (TAU). Parasites’ boundaries are depicted by white dashed lines. Scale bars: 5 µm. (B) Quantification of parasites that present some of the cruzipain distribution patterns (Anterior, Posterior or Homogeneous) according to the nutritional condition. Data are shown as mean ± error of three independent experiments. A total of 100 parasites per group for each experiment were quantified. P values were calculated using the Student 2-tailed unpaired t-test. (**) p ≤ 0.01, (***) p ≤ 0.001. (C) Immunofluorescence analysis of cruzipain distribution respect to fluorescent beads (late endosome marker) in epimastigotes (Y WT strain) at the end of the first stage of metacyclogenesis with BHT or TAU treatment. Parasites’ boundaries are depicted by white dashed lines. Scale bars: 5 µm. (D) Quantification of colocalization degree of cruzipain with fluorescent beads according to the nutritional condition. Data are shown as mean ± error of three independent experiments. A total of 50 parasites per group for each experiment were quantified. P values were calculated using the Student 1-tailed unpaired t-test. (***) p ≤ 0.001. (E) Immunofluorescence analysis of cruzipain disposition respect to the Tc Atg8.1 protein (autophagic marker) in epimastigotes (Y WT strain) induced to undergo autophagy (TAU) or not (BHT) during the first stage of metacyclogenesis. Parasites’ boundaries are depicted by white dashed lines. Scale bars: 5 µm. (F) Quantification of colocalization degree of cruzipain with Tc Atg8.1 protein according to the nutritional condition. Data are shown as mean ± error of three independent experiments. A total of 50 parasites per group for each experiment were quantified. P values were calculated using Student’s 2-tailed unpaired t-test. (*) p ≤ 0.05
