Figure 8.

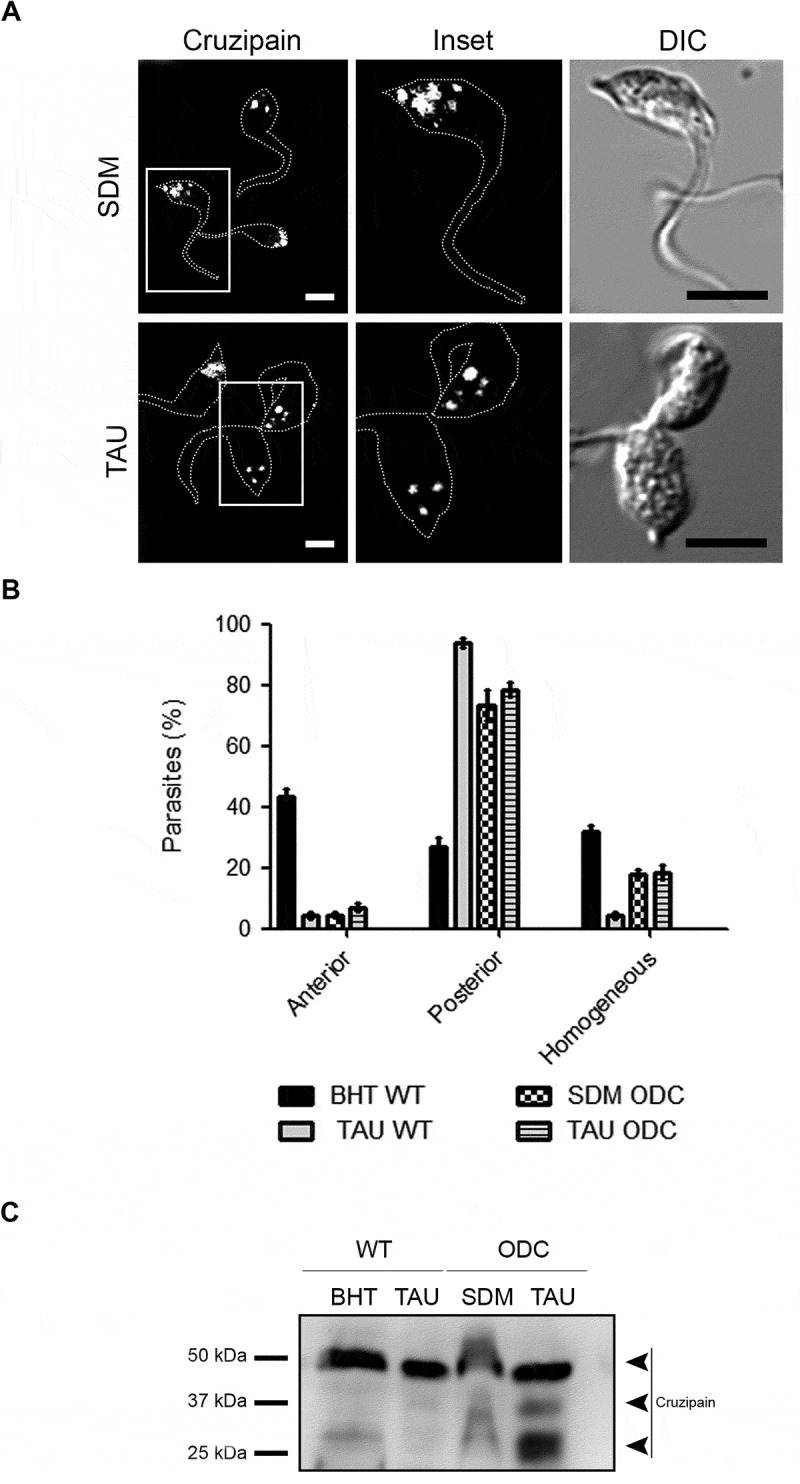
Cruzipain is highly processed in a mutant strain with activated autophagy. (A) Immunofluorescence analysis of cruzipain distribution in epimastigotes (Y-GFP-ODC strain) exposed to the first stage of metacyclogenesis under optimal nutritional conditions (SDM) or nutritional stress as an autophagy stimulus (TAU). Parasites’ boundaries are depicted by white dashed lines. Scale bars: 5 µm. (B) Quantification of parasites that present some of the cruzipain distribution patterns (Anterior, Posterior or Homogeneous) according to the nutritional condition. Data are shown as mean ± error of three independent experiments. A total of 100 parasites per group for each experiment were quantified. P values were calculated using Student’s 2-tailed unpaired t-test. (***) p ≤ 0.001. (C) Western blot analysis of cruzipain in total protein extracts from epimastigotes (Y-GFP strain vs. Y-GFP-ODC strain) exposed to in vitro metacyclogenesis. Samples were collected after 2 h (first stage) and lysates were obtained. The different forms of cruzipain were detected with a polyclonal antibody against this protein. The arrowheads indicate the position of each cruzipain form in the order established above. Image is representative of three independent experiments
