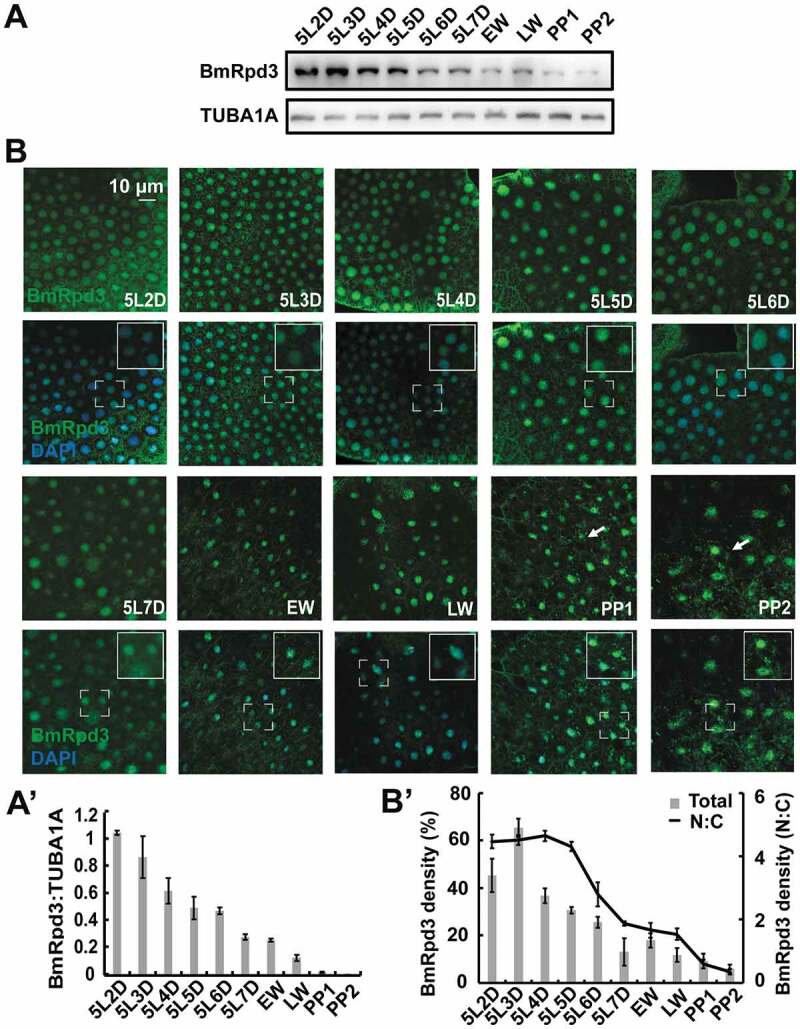
Figure 3.

Developmental profiles of BmRpd3 protein levels and subcellular localization in the fat body. (A-A’) Protein levels of BmRpd3 from 5L-2 to PP2. EW: early wandering stage, LW: late wandering stage, PP1: day 1 of the prepupa (A). Quantification of BmRpd3 compared to the TUBA1A in A (A’). (B-B’) Immunofluorescent staining of BmRpd3 from 5L-2 to PP2 (B). Quantification of the total (columns) and nuclear/cytoplasmic (line chart) BmRpd3 in B (B’). N: nucleus, C: cytoplasm, arrows indicate the typical cell with BmRpd3 localized in the cytoplasm
