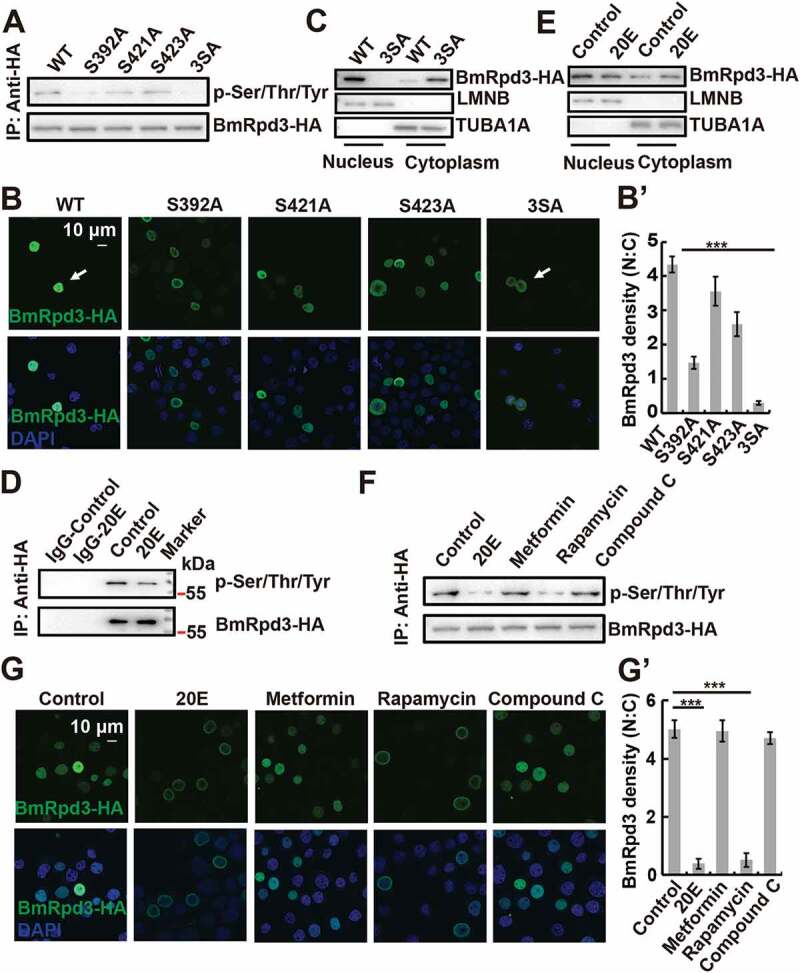
Figure 5.

Phosphorylation levels and subcellular localization of BmRpd3 after its phosphorylation sites mutation, 20E treatment, and MTORC1 inhibition in BmN cells. (A) Phosphorylation levels of BmRpd3-HA with a mutation at S392A (Ser392 to Ala392), S421A (Ser421 to Ala421), S423A (Ser423 to Ala423) or 3SA under nutrient-rich conditions, 3SA: triple phosphorylation-site mutation, IP: immunoprecipitation. (B-B’) Subcellular localization of BmRpd3-HA with a mutation at S392A, S421A, S423A or 3SA under nutrient-rich conditions (B). Quantification of fluorescent BmRpd3-HA in the nucleus and the cytoplasm in B (B’), N: nucleus, C: cytoplasm. (C) BmRpd3-HA protein levels in the nuclear and cytoplasmic proteins after the triple phosphorylation-site mutation, LMNB and TUBA1A are respectively used as nuclear and cytoplasmic reference proteins. (D) BmRpd3-HA phosphorylation levels after 20E treatment for 6 h, IgG immunoprecipitation is used as the negative control. (E) BmRpd3-HA protein levels in the nuclear and cytoplasmic proteins after 20E treatment for 6 h. (F-G’) Phosphorylation levels (F), and immunofluorescent staining of BmRpd3-HA (G) after 20E, metformin, rapamycin or compound C treatment for 6 h. Quantification of fluorescent BmRpd3-HA in the nucleus and the cytoplasm in G (G’)
